Adjusting plotting parameters
Once we have selected a plot.type with its chromosome organization and its data panels, we can further customize the general plot apperance using plotting parameters. Plotting parameters define the relative sizing of the different elements, their margins and positions.
What plotting parameters are available?
The easiest way to see the avialable plotting parameters and their default
values for a given plot type is to use a utility function that plots the default
plot params, aptly named plotDefaultPlotParams(). It will create a karyoplot
with 2 chromosomes using the given plot type and draw all the available plotting
parameters and their default values on them.
library(karyoploteR)
plotDefaultPlotParams(plot.type=2)
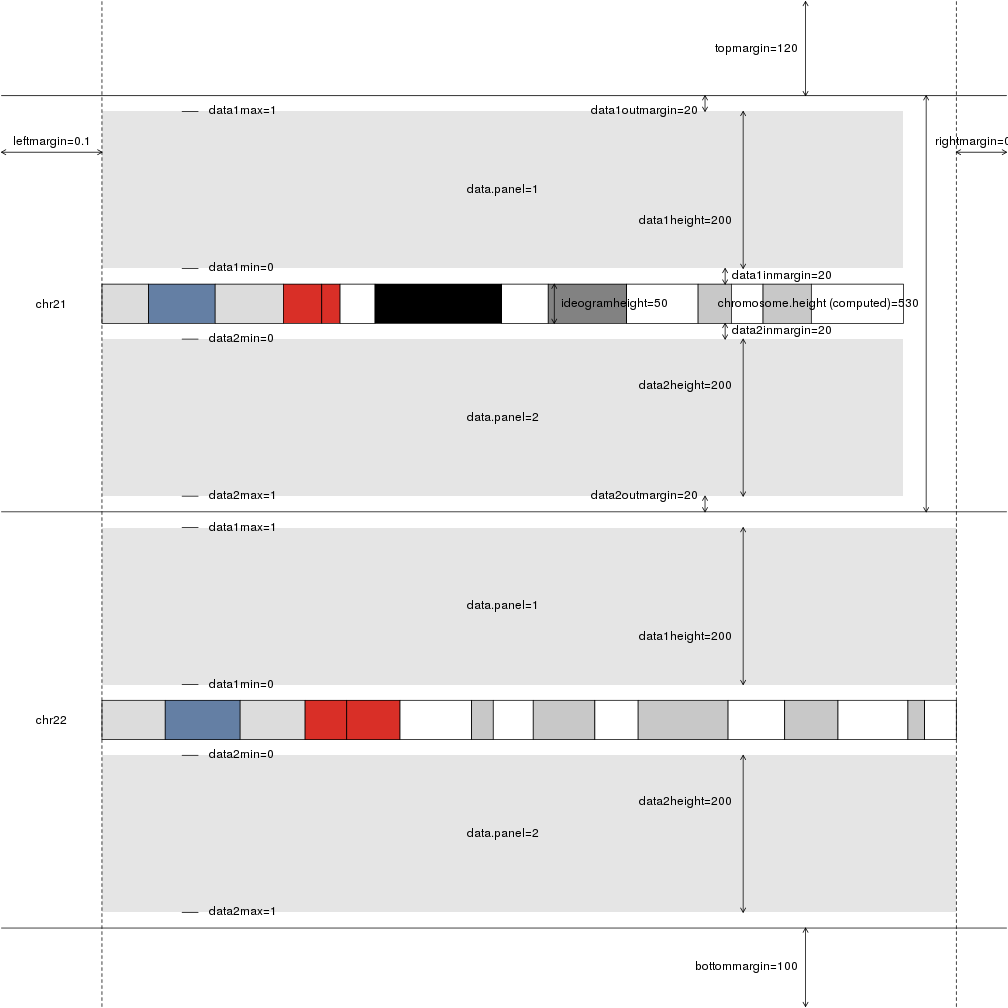
In addition to the margins and sizes, includes the names of the available data panels as well as their default minimum and maximum values.
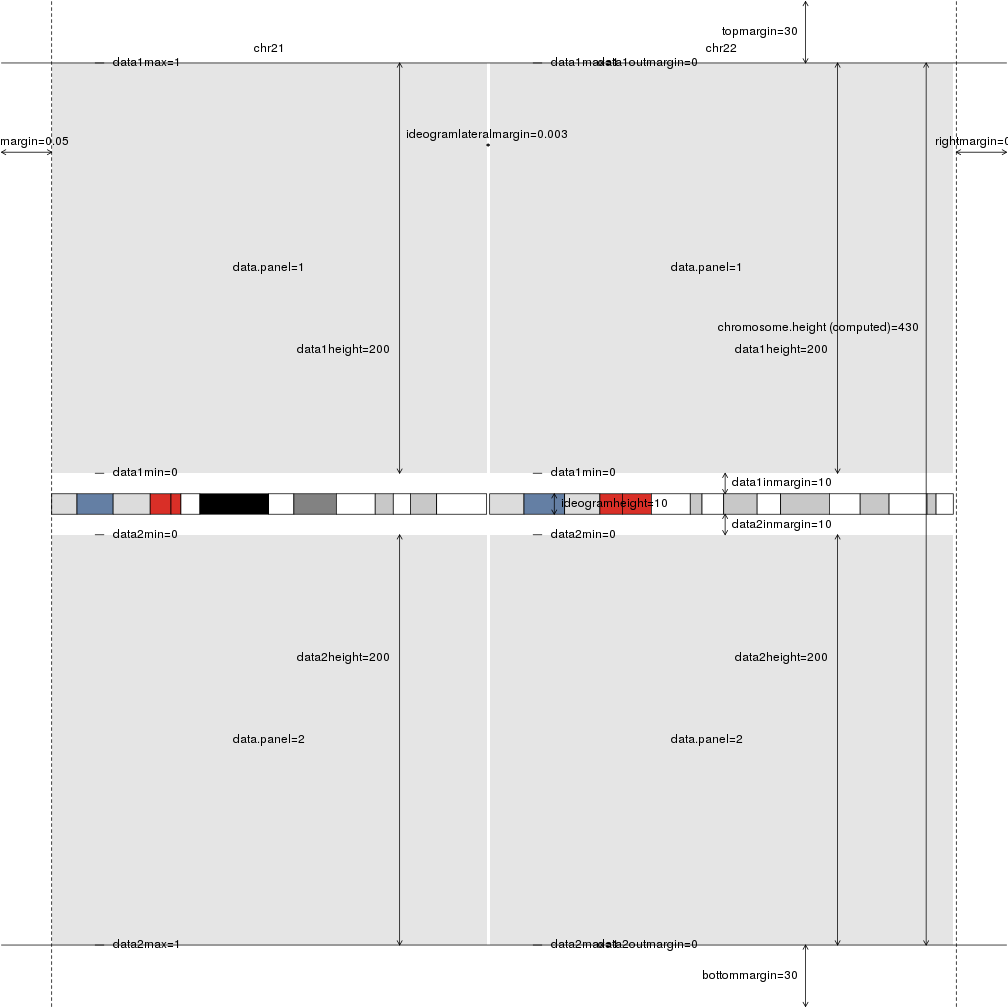
Giving it a different plot type will produce the plot adapted to it with the different default values.
plotDefaultPlotParams(plot.type=3)
How can I change the plotting parameters?
Plotting parameters have to be passed to plotKaryotype using the plot.params
parameter. Since plotting parameters have to be a list with values for all
plotting parameters, the recommended way of changing them is getting the
object with the default values using getDefaultPlotParams(), modify the
desired values and passing the modified object to plotKaryotype.
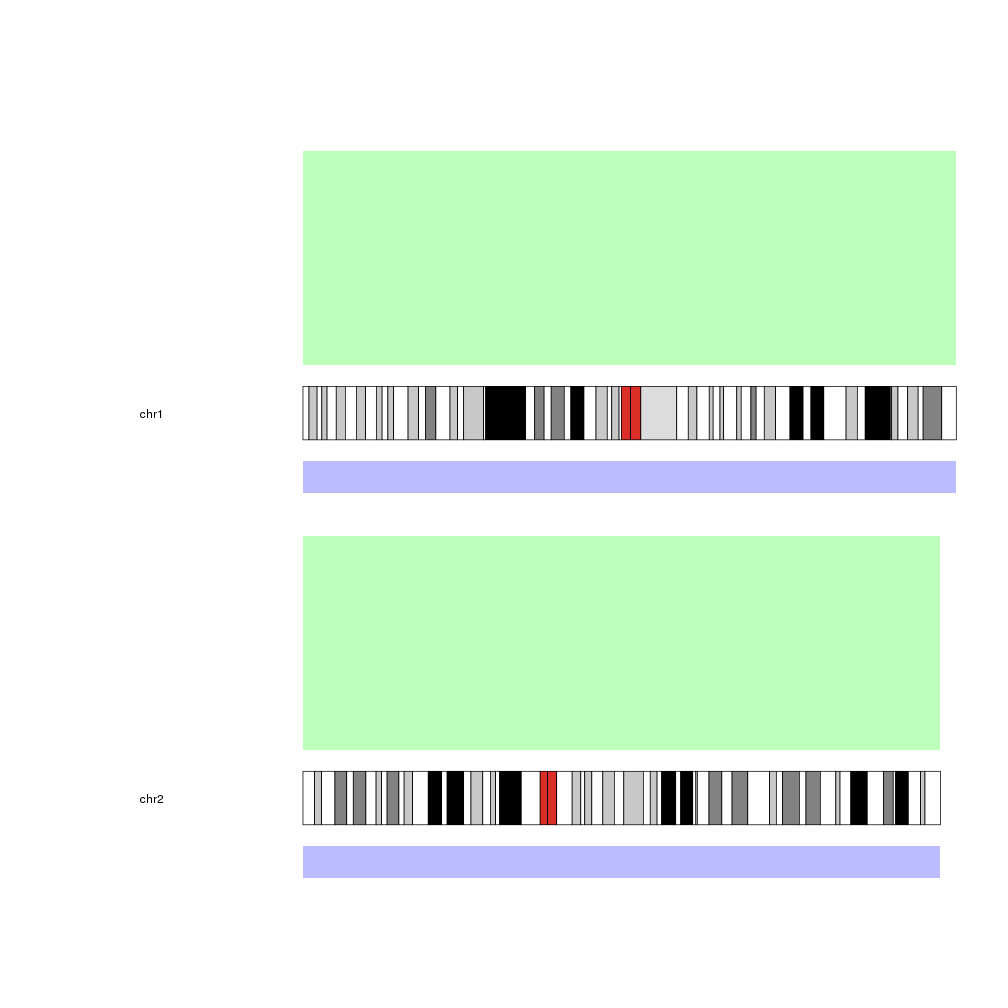
For example, to create a big margin on the left-hand side and reduce the size of the second data panel, we can use:
pp <- getDefaultPlotParams(plot.type=2)
pp$leftmargin <- 0.3
pp$data2height <- 30
kp <- plotKaryotype(chromosomes=c("chr1", "chr2"), plot.type=2, plot.params = pp)
kpDataBackground(kp, data.panel = 1, color = "#BBFFBB")
kpDataBackground(kp, data.panel = 2, color = "#BBBBFF")
Note: The example on how to plot on the ideograms has been removed. To plot
on the ideograms, please use the new data.panel="ideogram" as explained in
data panels.
