Plotting Arrows
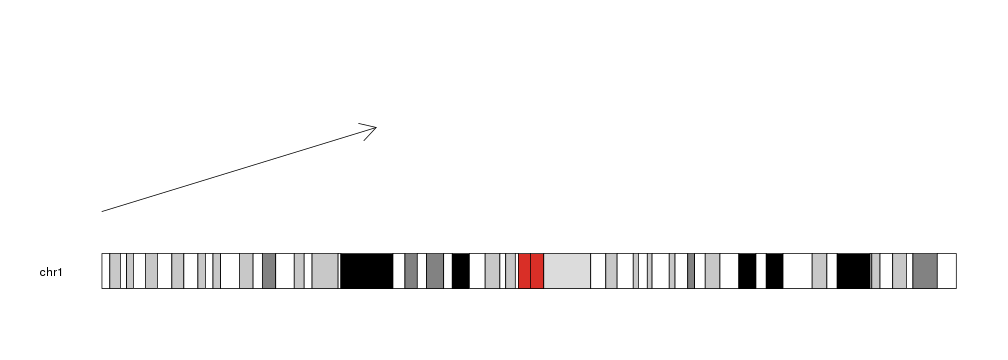
To plot arrows in a karyoplot we need to use the kpArrows function. Given a
character vector chr and 4 integer vectors x0, y0, x1 and y1 it
will plot arrows going from (x0, y0) to (x1, y1).
library(karyoploteR)

kp <- plotKaryotype(chromosomes="chr1")
kpArrows(kp, chr="chr1", x0=0, x1=80e6, y0=0.2, y1=0.8)
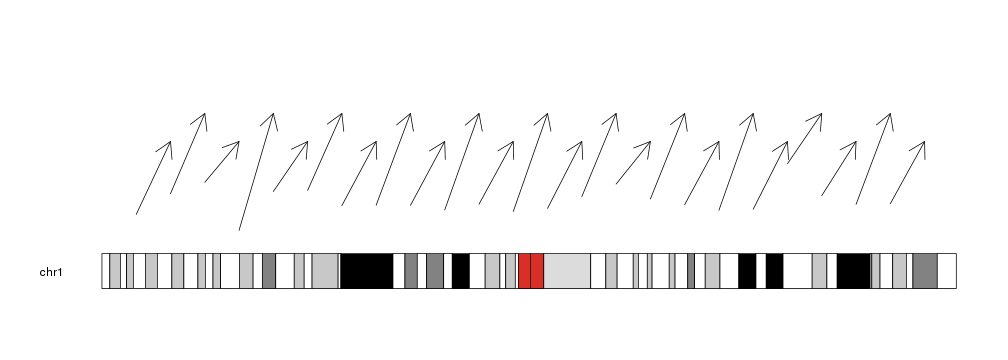
We can give it vectors of positions and it will plot an arrow for each element in the vectors (recycling them if necessary).
x0 <- 1:23*10e6
x1 <- 2:24*10e6
y0 <- rnorm(23, mean=0.3, sd=0.1)
y1 <- c(0.7, 0.9)

kp <- plotKaryotype(chromosomes="chr1")
kpArrows(kp, chr="chr1", x0=x0, x1=x1, y0=y0, y1=y1)
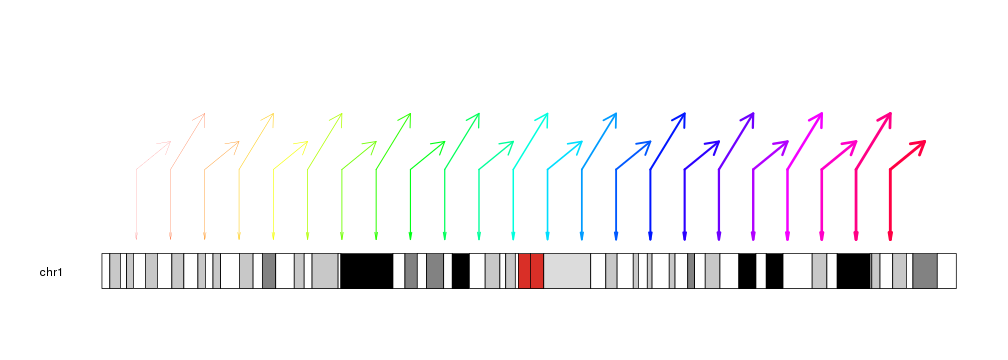
The lines can be customized with the same
graphical parameters
as in the R base graphics arrows function: lwd, lty, col, length,
angle…
kp <- plotKaryotype(chromosomes="chr1")
kpArrows(kp, chr="chr1", x0=x0, x1=x1, y0=0.5, y1=y1, col=rainbow(23),
          lwd=(1:23)/6, angle=30, length=0.2)
kpArrows(kp, chr="chr1", x0=x0, x1=x0, y0=0.5, y1=0, col=rainbow(23),
          lwd=(1:23)/6, angle=10, length=0.1)