Plotting links between genomic regions
The kpPlotLinks function plots lines between pairs of genomic regios. It is useful to depict translocations and other genomic rearrangements. Links are plotted as curved bezier lines between the start (end) of a region and the start (end) of its pair with the space bewteen them optionally filled. The strand of the region is taken into account and therefore it is possible to represent inversions.
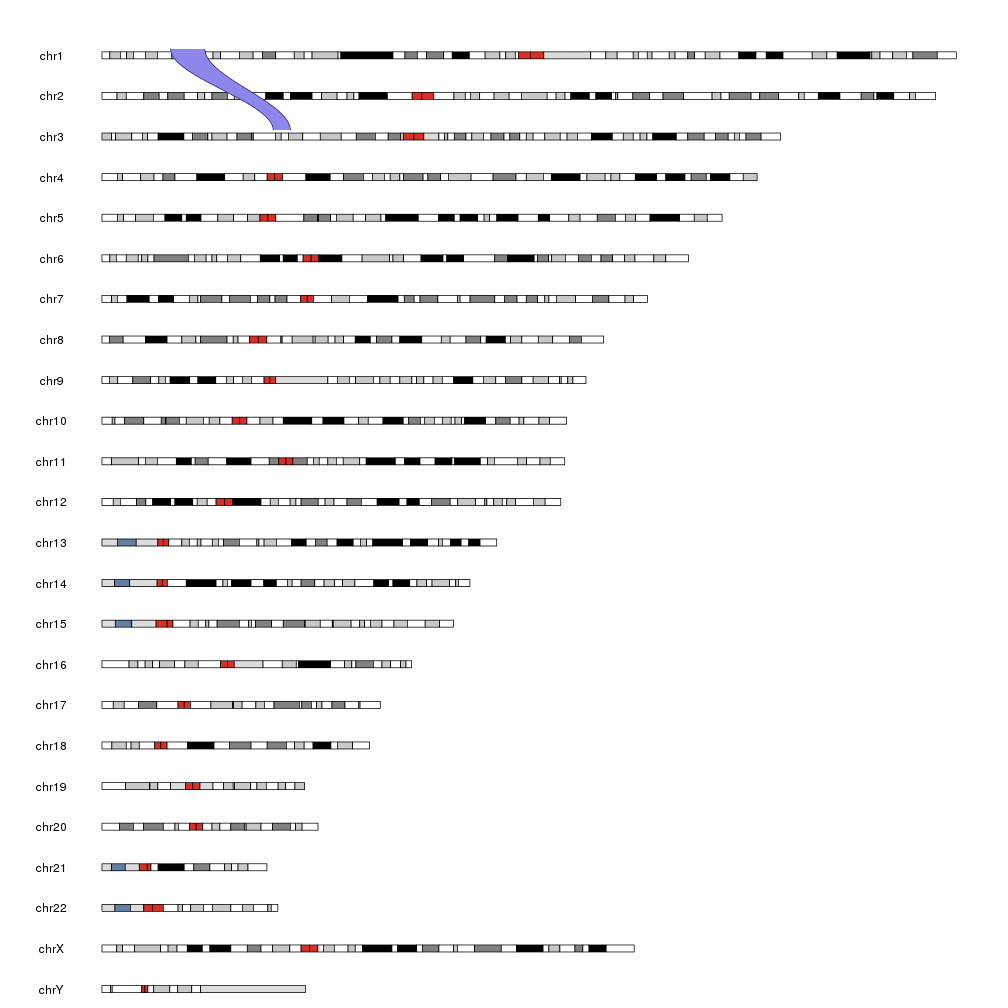
The easiest way of specifying the regions to plot is with 2 GRanges objects: one for the starts of the links and the other for the ends.
library(karyoploteR)
start.regs <- toGRanges(data.frame("chr1", 20e6, 30e6))
end.regs <- toGRanges(data.frame("chr3", 50e6, 55e6))

kp <- plotKaryotype()
kpPlotLinks(kp, data=start.regs, data2=end.regs)
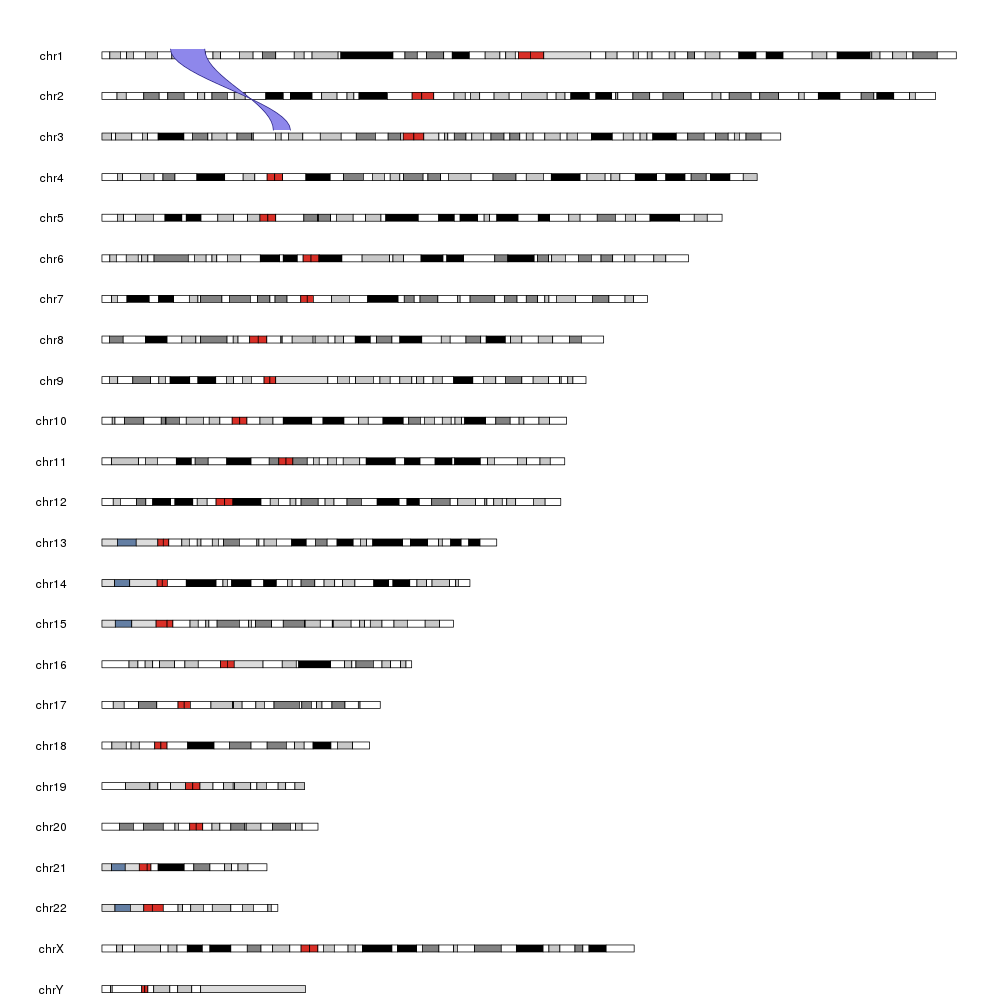
And we can flip one of the regions by setting it to the negative strand.
strand(end.regs)[1] <- "-"

kp <- plotKaryotype()
kpPlotLinks(kp, data=start.regs, data2=end.regs)
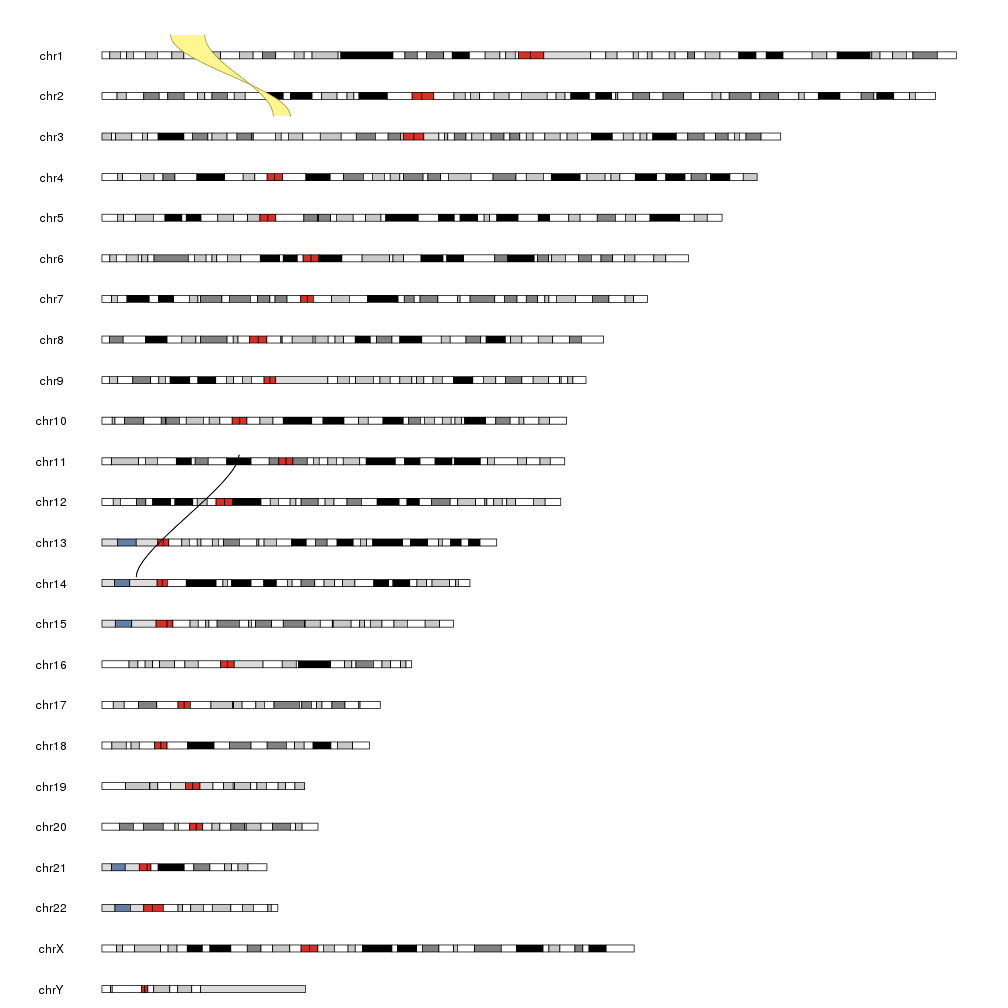
We can use col and border to change the appearance of the link, including
setting them to NA to not be plotted and we can create sigle line links with
small-enought regions. We can also change the vertical position of the links
start and end with the y parameter (and the standard r0, r1, etc…).
start.regs.small <- toGRanges(data.frame("chr14",10e6, 10e6))
end.regs.small <- toGRanges(data.frame("chr11", 40e6, 40e6))

kp <- plotKaryotype()
kpPlotLinks(kp, data=start.regs, data2=end.regs, col="#FFF68F", y=0.5)
kpPlotLinks(kp, data=start.regs.small, data2=end.regs.small, col="black")
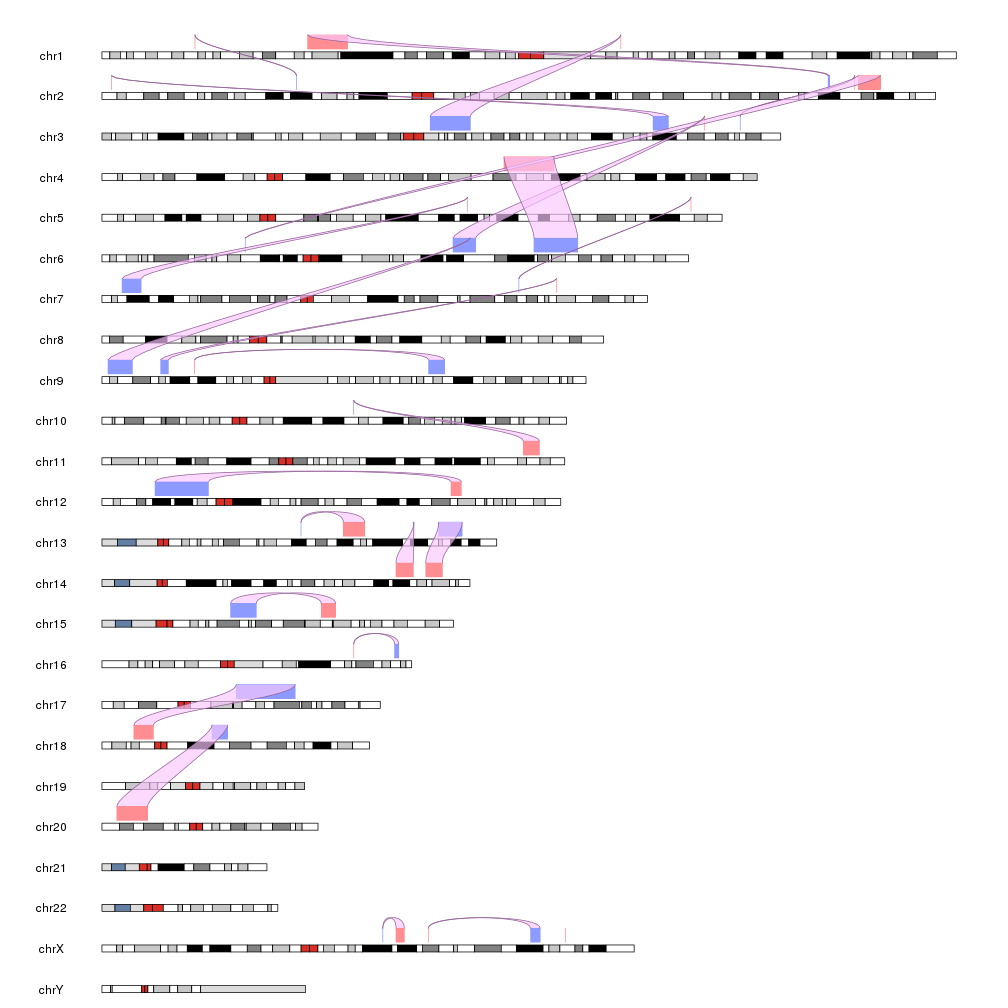
And we can plot multiple links creating a larger GRanges object. The only restriction is that data and data2 must be of equal length, since the n-th region in data will be linked to the n-th region in data2.
For example we can create a bunch of random regions and link them.
starts <- sort(createRandomRegions(nregions = 25, length.sd = 8e6))
ends <- sort(createRandomRegions(nregions = 25, length.sd = 8e6))

kp <- plotKaryotype()
kpPlotRegions(kp, starts, r0=0, r1=0.5, col="#ff8d92")
kpPlotRegions(kp, ends, r0=0, r1=0.5, col="#8d9aff")
kpPlotLinks(kp, data=starts, data2=ends, col="#fac7ffaa", r0=0.5)