karyoploteR is an R package to create karyoplots, that is, representations of whole genomes with arbitrary data plotted on them. It is inspired by the R base graphics system and does not depend on other graphics packages. The aim of karyoploteR is to offer the user an easy way to plot data along the genome to get broad genome-wide view to facilitate the identification of genome wide relations and distributions.
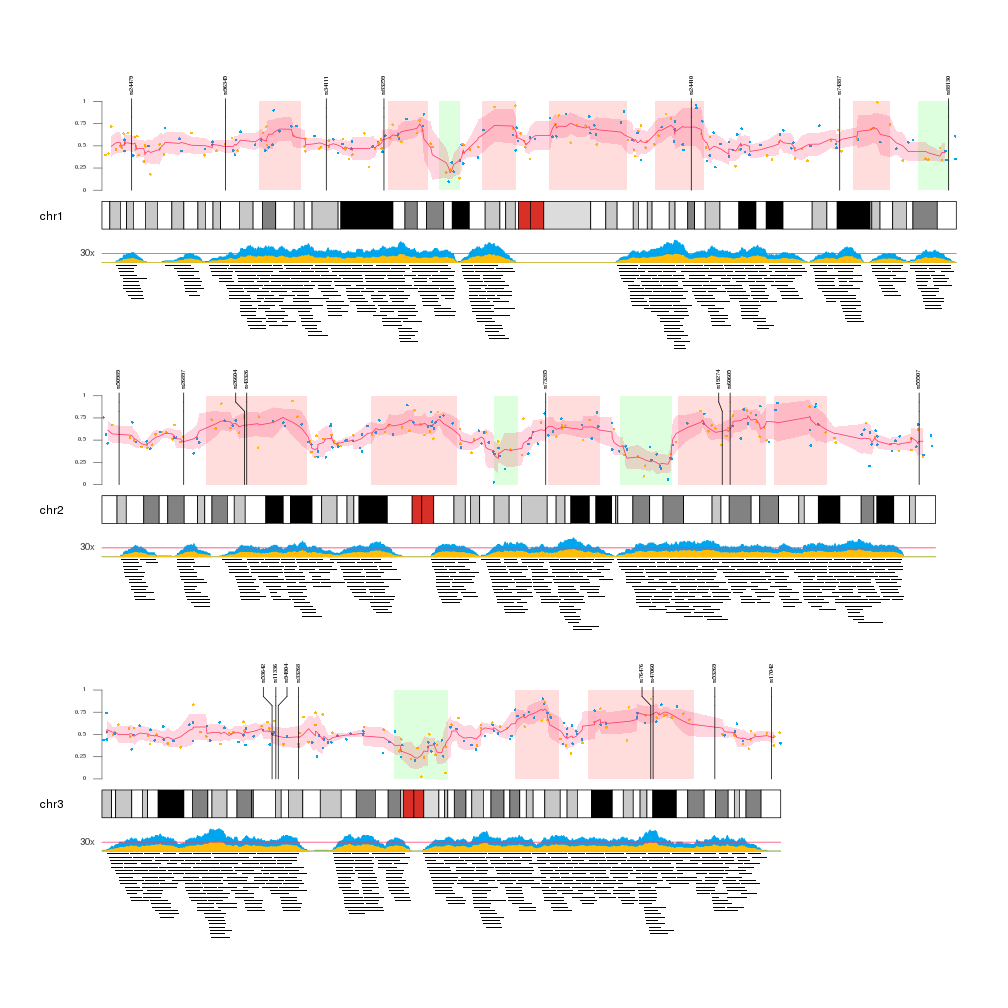
Example - Multiple Data Types
See Example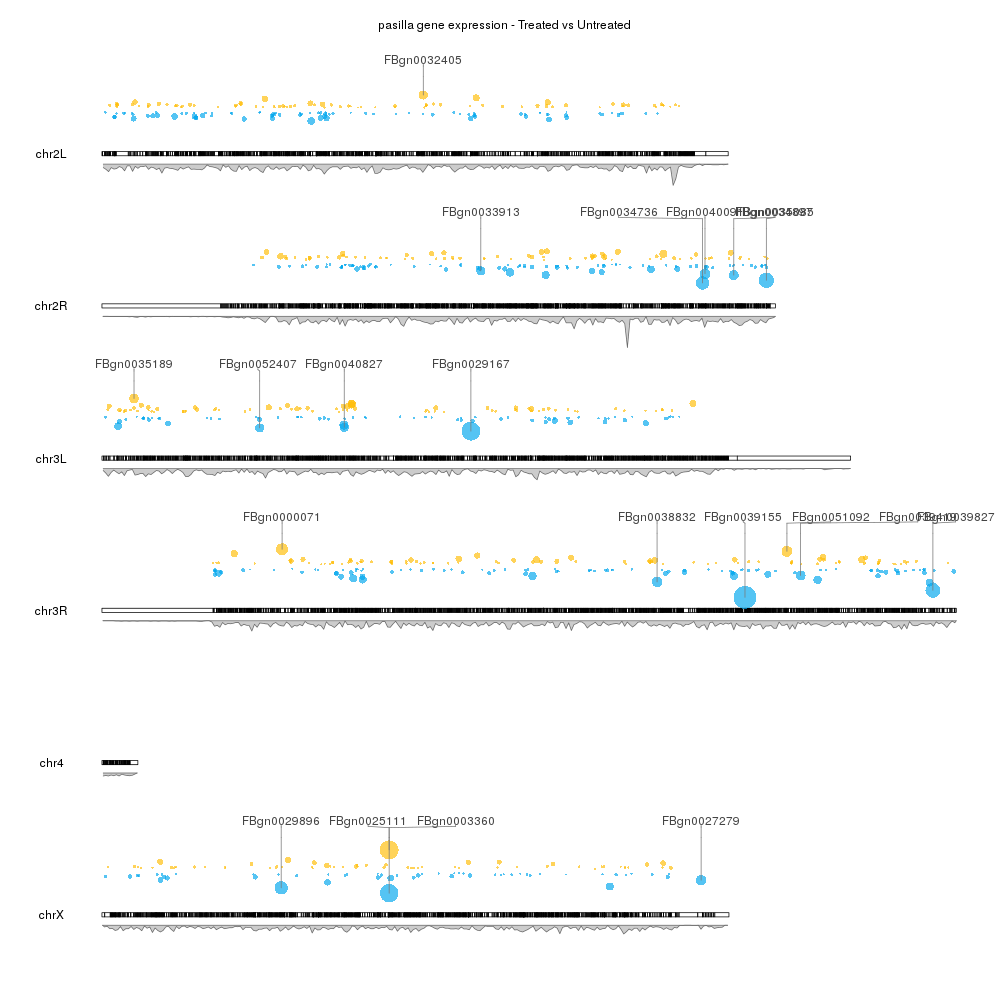
Example - Gene Expression - Drosophila
See Example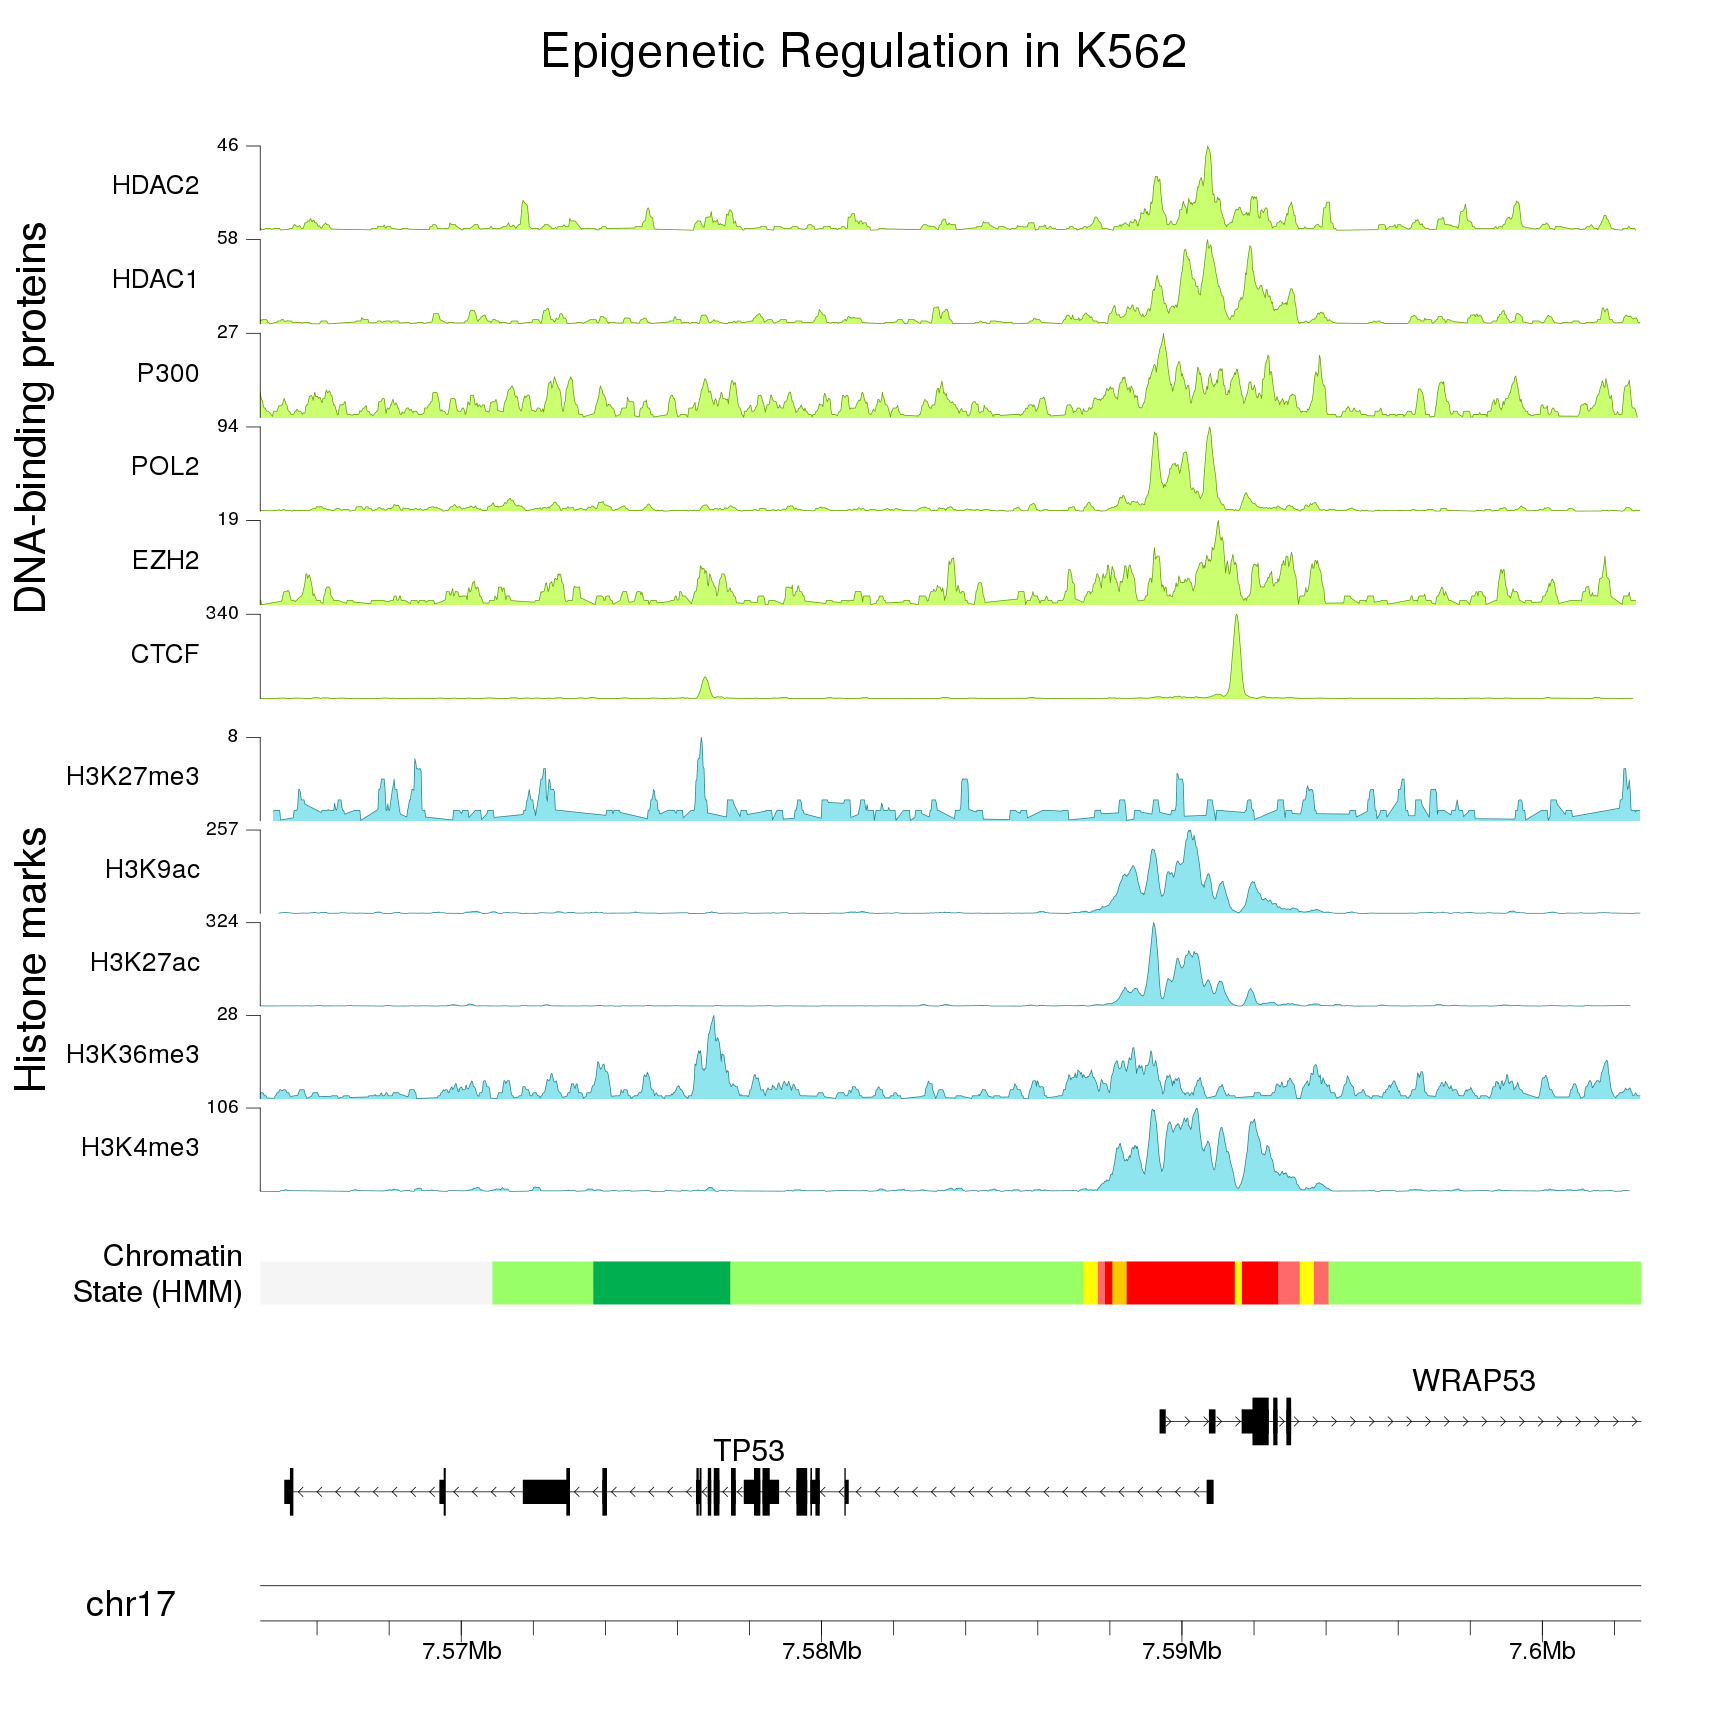
Example - Epigenetic data from ENCODE
See Example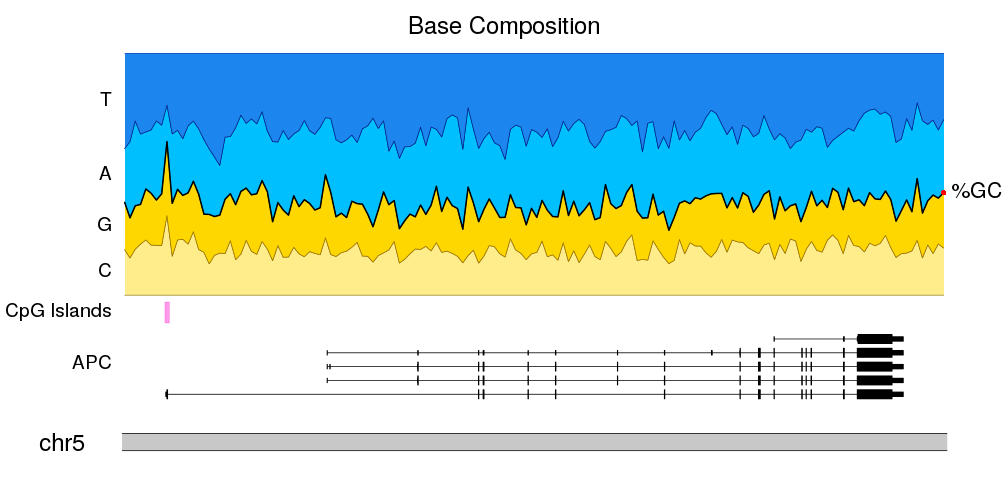
Example - Nucleotide Frequency
See Example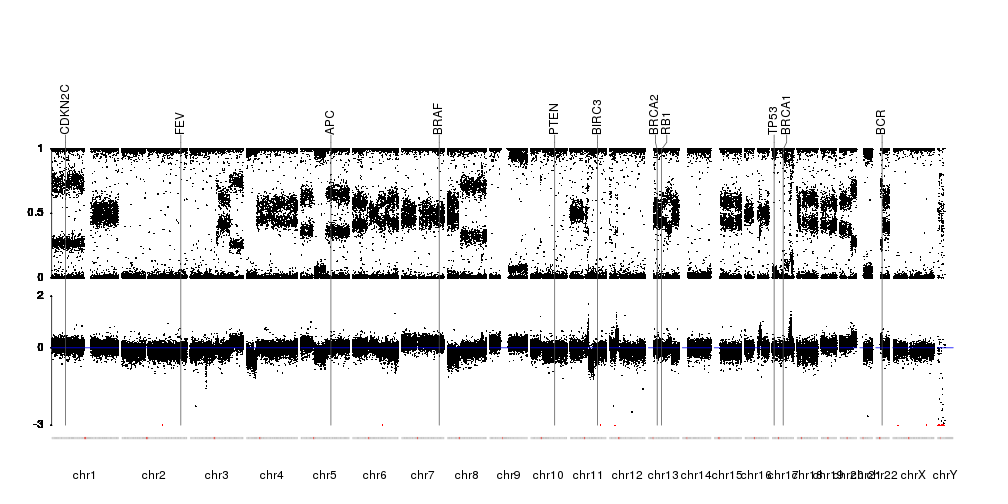
Example - SNP-array raw data
See Example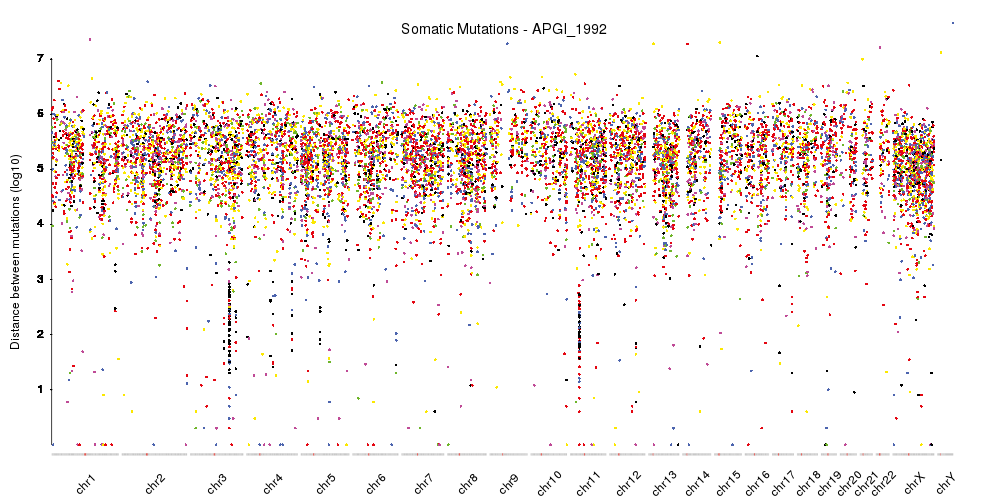
Example - Rainfall Plots
See Example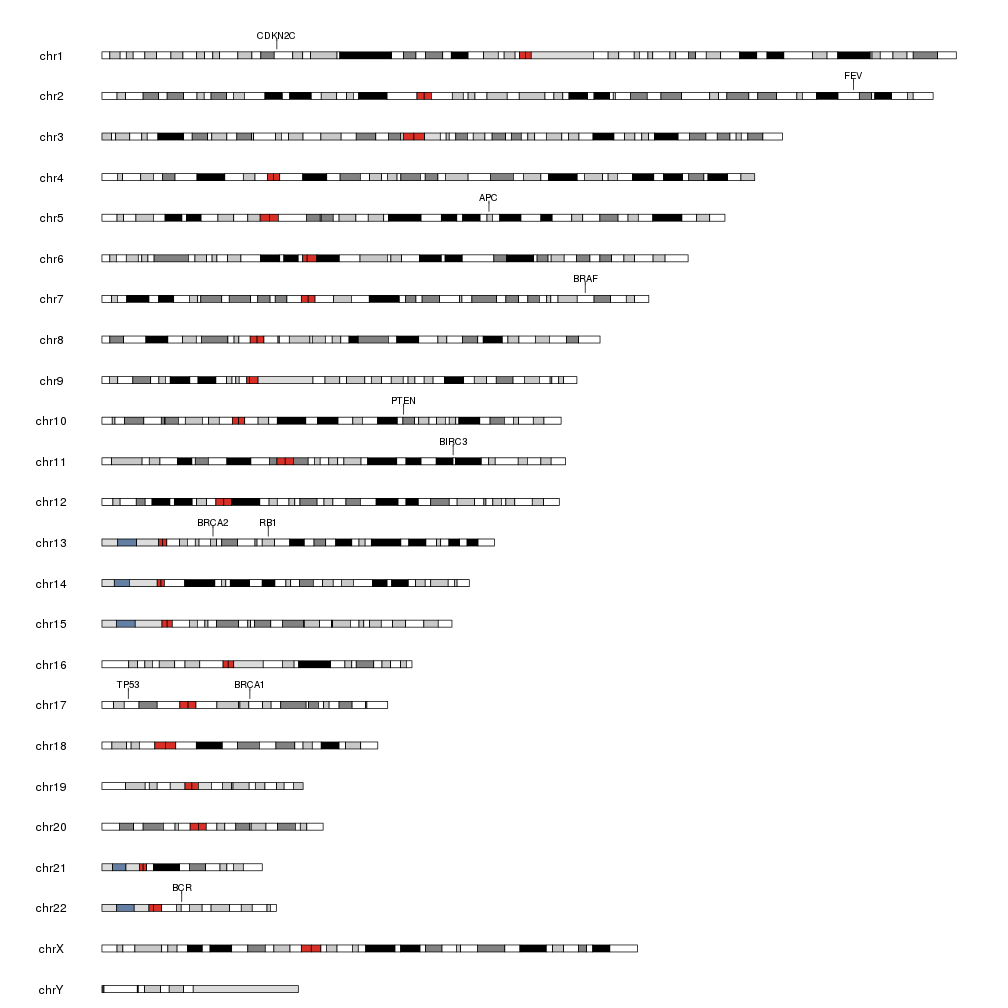
Example - Plot Genes
See Example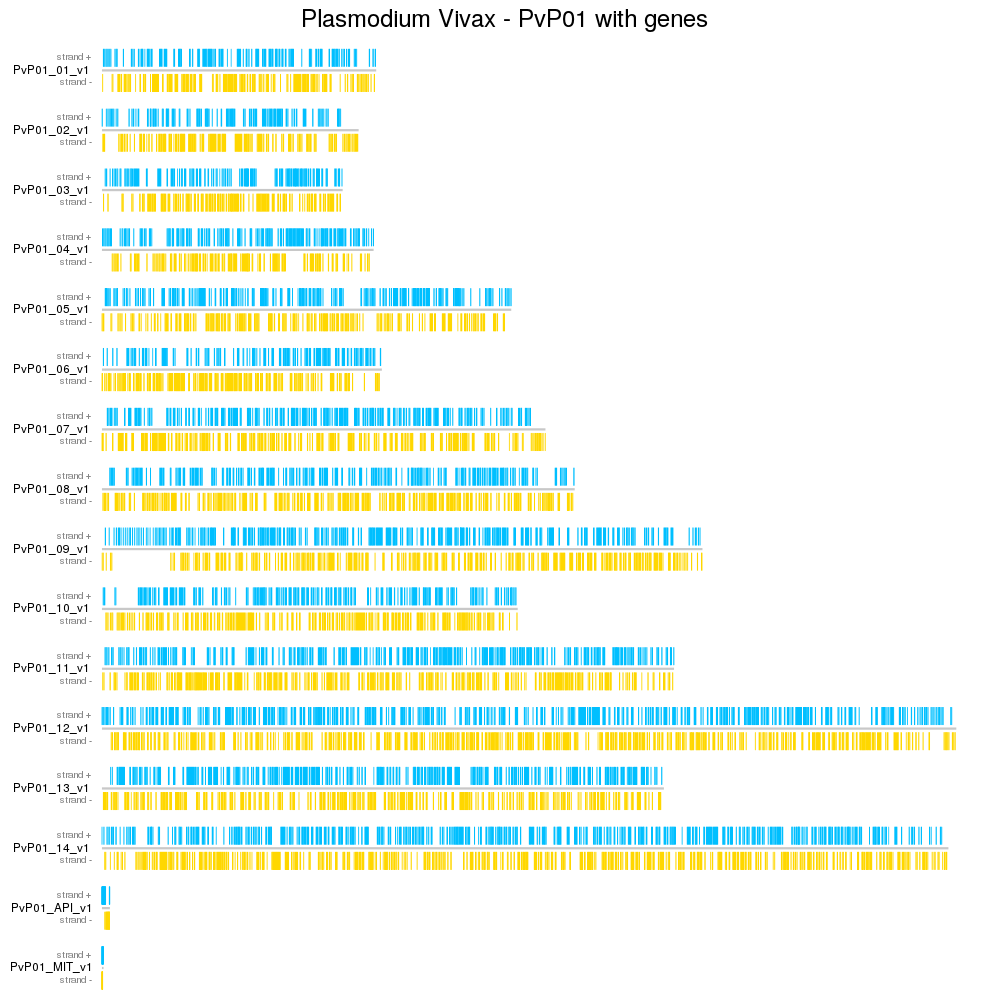
Example - Plasmodium Vivax Genes from GFF
See Example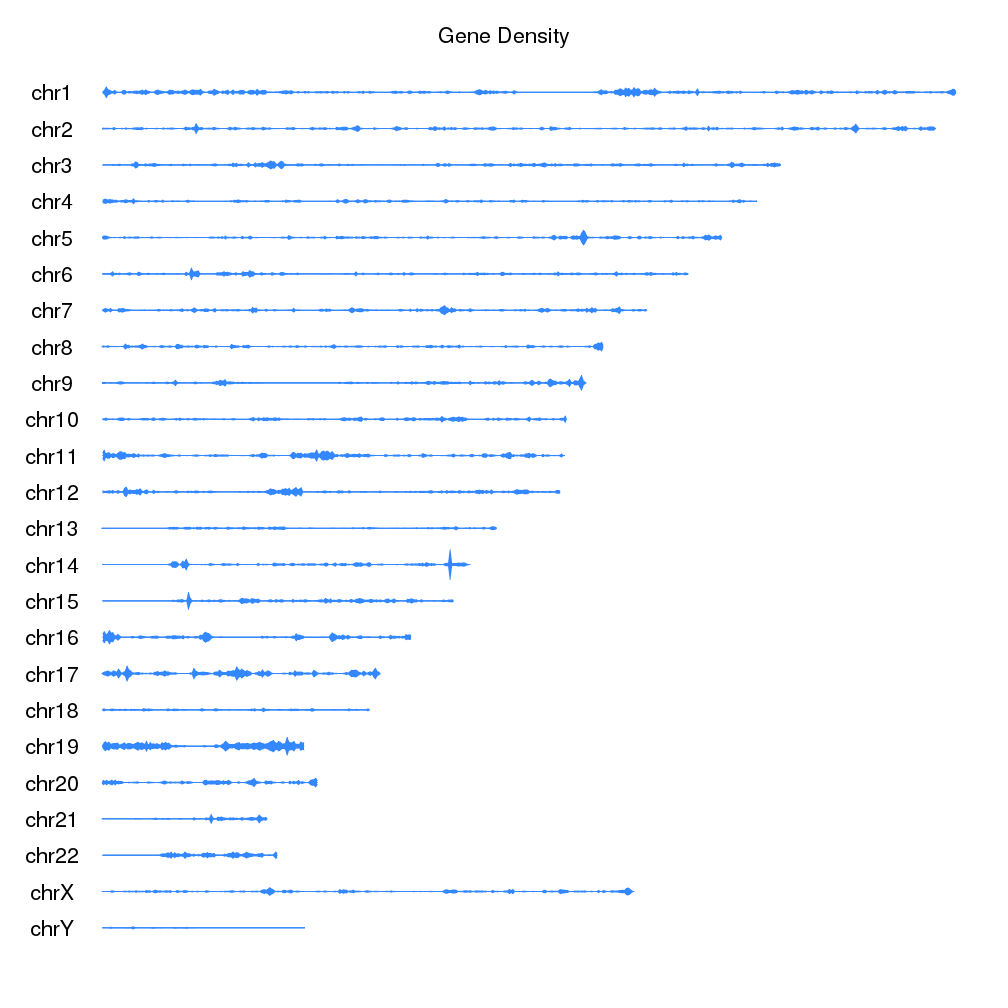
Example - Gene Density on the Ideogram
See Example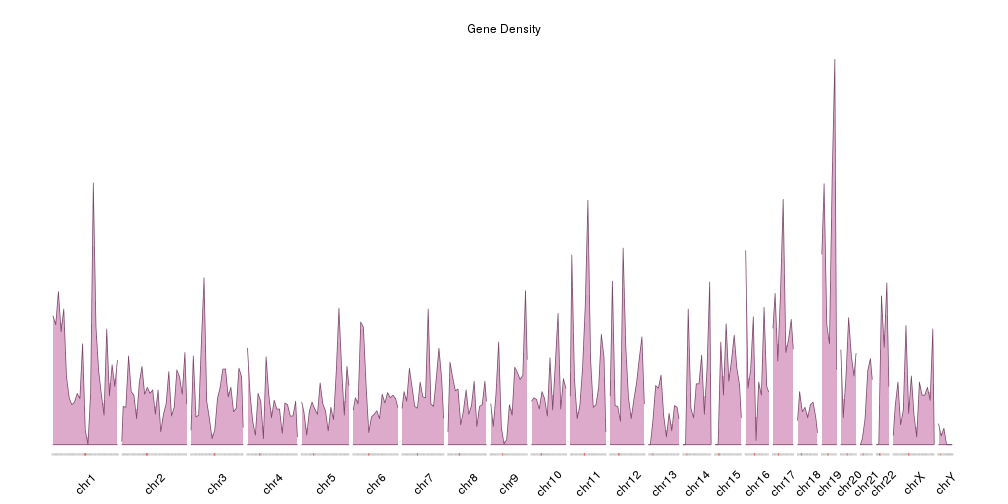
Example - Gene Density
See Example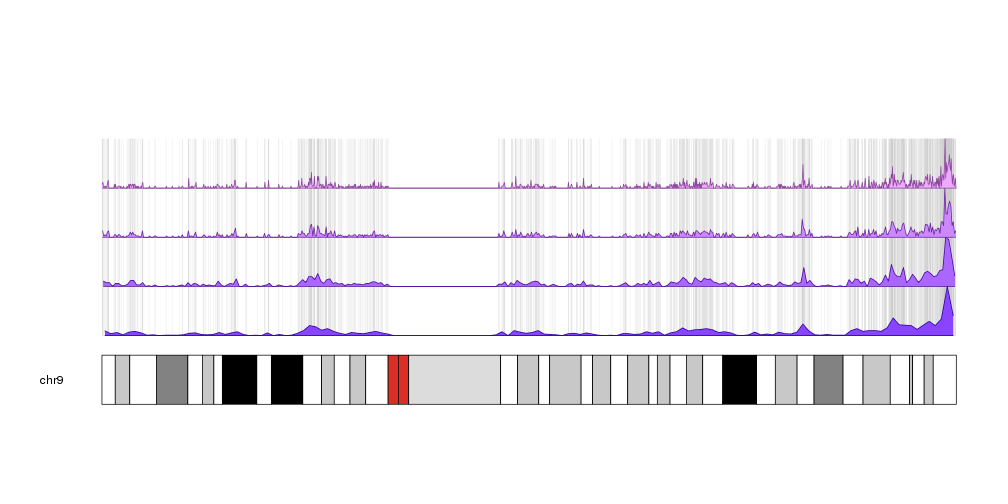
Example - Plot CpG Islands
See Example
karyoploteR is based on base R graphics and mimicks its interface. You first create a plot with a call
to the plotKaryotype function and then sequentially call a number of plotting functions (kpLines, kpPoints,
kpBars…) to add data to the genome plot.
karyoploteR is a plotting tool and only a plotting tool. That means that it is not able to download or retrieve any data. The downside of this is that the user is responsible of getting the data into R. The upside is that it is not tied to any data provider and thus can be used to plot genomic data coming from anywhere. The only exception to this are the ideograms cytobands, that by default are plotted using predownloaded data from UCSC.
karyoploteR is useful in any situation where a general genome-wide view of data is desirable. It can be used to plot somatic copy-number changes (SCNA) in cancer genomes obteined from exome, aCGH or SNP-array data; to plot the global BAM coverage from a WGS experiment; to create manhattan plots from GWAS studies; to create rainfall plots to detect kataegis. Since it is not tied to any data type or source, karyoploteR can be used to plot almost anything on a genome-wide scale.
Getting Started
karyoploteR is part of Bioconductor since version BioC 3.5. The package documentation, including the vignette and user manual is available at the karyoploteR’s Bioconductor landing page at http://bioconductor.org/packages/karyoploteR.
To install the package you’ll need to use Bioconductor’s own package manager, called BiocManager.
To do so, simply start R and enter the following code:
  if (!requireNamespace("BiocManager", quietly = TRUE))
    install.packages("BiocManager")
  BiocManager::install("karyoploteR")
Usign the development version
To use the development version of karyoploteR
you should use the devel version of Bioconductor. The
devel version of the package might work with release version of Bioconductor, althought that’s not expected to be
always the case. You should be able to install the development version from the
github repo using install_github()
from the devtools package.
Citing karyoploteR
karyoploteR has been developed by Bernat Gel and Eduard Serra at IGTP Hereditary Cancer Group.
If you use karyoploteR in your research, please cite the Bioinformatics paper describing it:
Bernat Gel & Eduard Serra. (2017). karyoploteR: an R/Bioconductor package to plot customizable genomes displaying arbitrary data. Bioinformatics, 31–33. doi:10.1093/bioinformatics/btx346
Tutorial
Important Note: All documentation here refers to the latest released version of Bioconductor. Some functionality may be missing in older version. If a
documented function is only available in the devel version of the package, it will be clearly stated that it’s not yet available in release.
The tutorial is a work in progress yet. Feel free to contact us to ask for any clarification or propose a a new section.
Ideograms and other non-data graphical elements
- Plot ideograms
- Filter and reorder chromosomes
- Using custom genomes
- Adding base numbers and cytoband labels
- Data Panels
- Plot Types
- Changing the plotting parameters
- Colors
- Labels
- Axis
- Data Positioning
- Autotrack
- Zooming for a detail view
Create ideograms for different organisms
Create ideograms of a subset of chromosomes and plot them in any order
Create ideograms using your own custom genomes including specifying your own cytobands
Add a base numbering guide to the ideograms and label the cytobands with their names
Define the parts of the karyoplots where data can be added
Select different ideogram and data layouts
Customize general plotting parameters (margins, sizings and positions)
karyoploteR functions to manage and assign colors
Add labels on the margins of data panels
Add y axis to data panels to define the range of the plotted data
Manage and adjust the exact positioning of data when plotting
Automatically set r0 and r1 to create multiple non-overlapping tracks
Zoom into a single region of the genome to get a detailed view of your data there.
Low-level Plotting Functions
- Overview of low-level plotting functions
- Points
- Lines
- Text
- Polygons
- Area
- Segments
- Rectangles
- Arrows
- Bars
Overview of the low-level plotting functions to plot basic graphical primitives (points, lines, arrows, poylgons...)
Plot points to create scatter plots
Plot lines on the genome
Add text labels on the data part of a karyoplot
Add polygons to a karyoplot
Plot a line and shade the area below
Plot segments on a karyoplot
Plot rectangles on a karyoplot
Plot arrows on a karyoplot
Plot bars on a karyoplot
High-level Plotting Functions
- Plotting markers (genes, snps, ...)
- Plotting Genomic Regions
- Plotting links betwee genomic regions
- Plotting the Density of Genomic Features
- Plotting the per base Coverage of Genomic Features
- Plotting BAM coverage
- Plotting Horizon plots
- Creating Manhattan plots
Plot markers (a line with a label) on the genome representing entities with a given position and idetified with a label, for example genes, snps, etc...
Plot regions on the genome with automatic layering to avoid overlapping
Plot links between different genomic regions (even in different chromosomes) to represent genomic rearrangements
Plot the density of features along the genome
Plot the coverage of features for every individual base in the genome
Plot the per-base coverage of a BAM file
Plot a horizon plot (aka horizon graph) on the genome
Plot a manhattan plot, the one usually used for GWAS studies, in your genome
