Plot an ideogram using a custom genomes
In addtion to using prebuilt genomes it is possible to plot ideograms using custom genomes. The only required information to do that, is a GRanges object with one range representing each chromosome.
For example, to create an ideogram of a cutom genome with chromosomes A and B of 100 and 200 bases we can do something like
library(karyoploteR)

custom.genome <- toGRanges(data.frame(chr=c("A", "B"), start=c(1, 1), end=c(100, 200)))

kp <- plotKaryotype(genome = custom.genome)

or using regioneR’s toGRanges to read the chromosome from a file, in this case
mygenome.txt
library(karyoploteR)

custom.genome <- toGRanges("Tutorial/CustomGenomes/mygenome.txt")

kp <- plotKaryotype(genome = custom.genome)

As you can see, however, no cytobands are plotted (since no cytoband information is available)
and the whole chromosomes are plotted in gray. If the cytobands information is available it
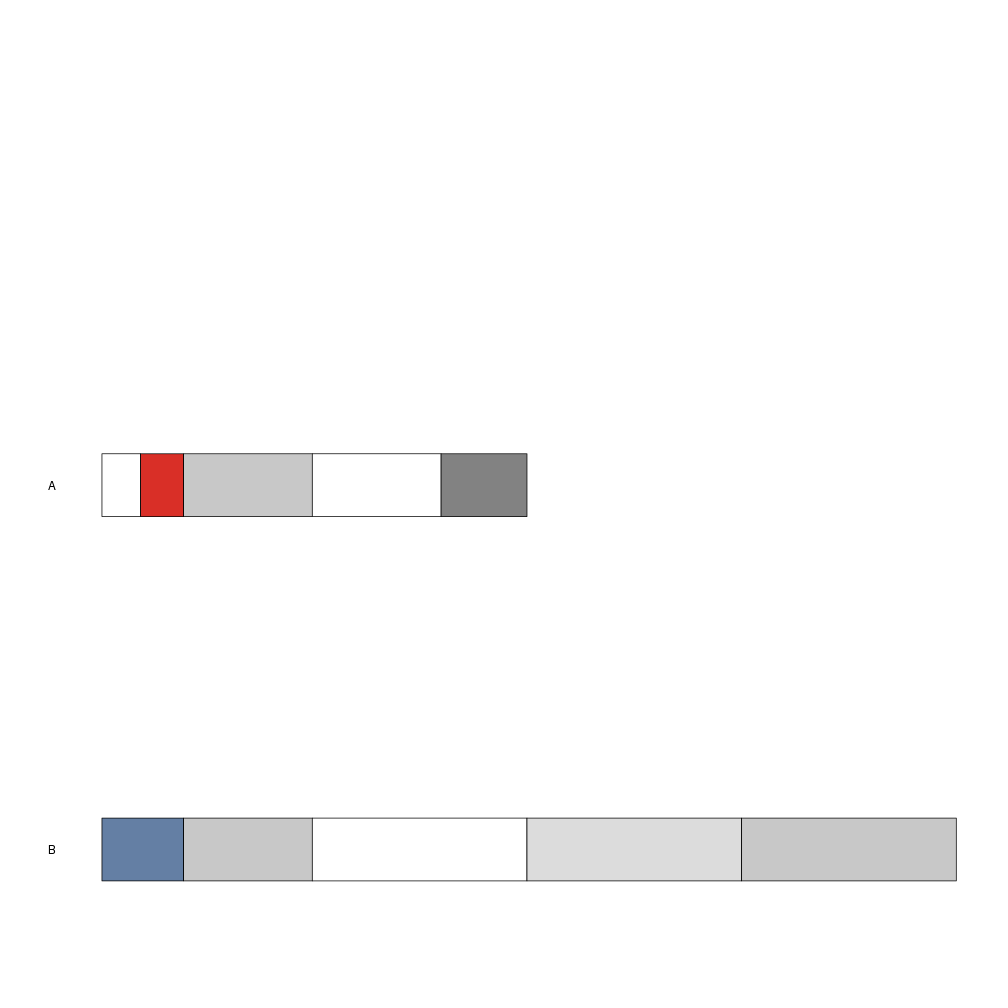
can be provided to plotKaryotype as a GRanges object with two additional columns:
name and gieStain. The gieStain levels are the ones used at UCSC: gneg,
gpos25, gpos75, gpos100, gvar, acen, stalk, etc. Here, for example,
we will use the mycytobands.txt file.
custom.genome <- toGRanges("Tutorial/CustomGenomes/mygenome.txt")
custom.cytobands <- toGRanges("Tutorial/CustomGenomes/mycytobands.txt")

kp <- plotKaryotype(genome = custom.genome, cytobands = custom.cytobands)