Plot Types
karyoploteR has different plot types available, each one defining a global
layout of ideograms and one or more data panel around them. Plot types are
specified at plot creation time in plotKaryotype with the plot.type
parameter and are identified by integers.
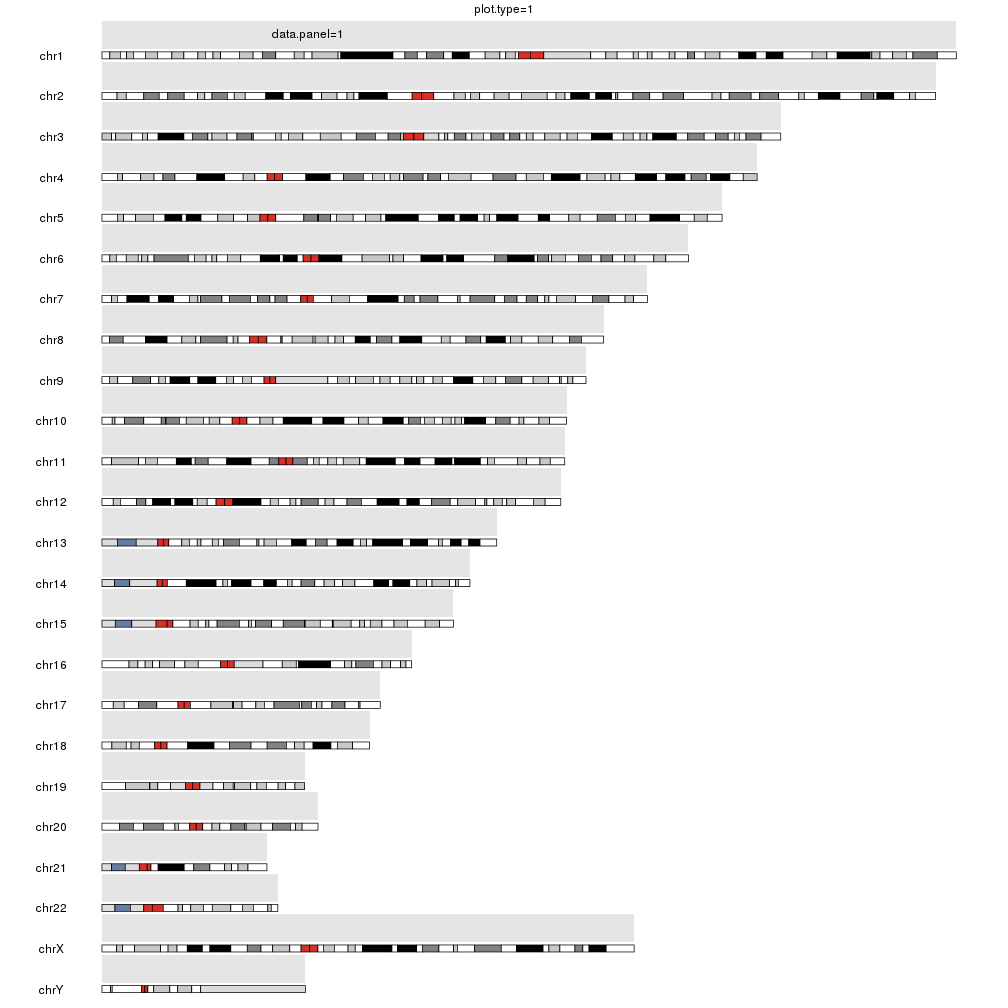
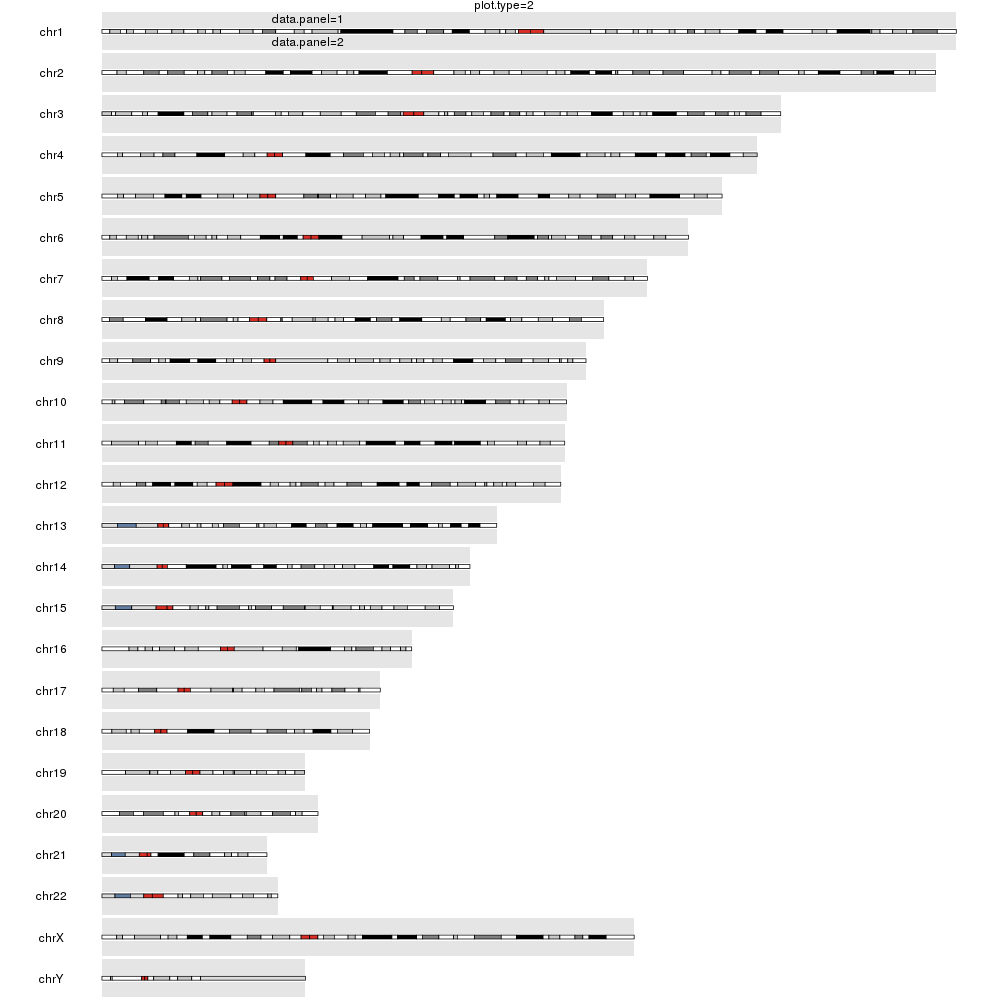
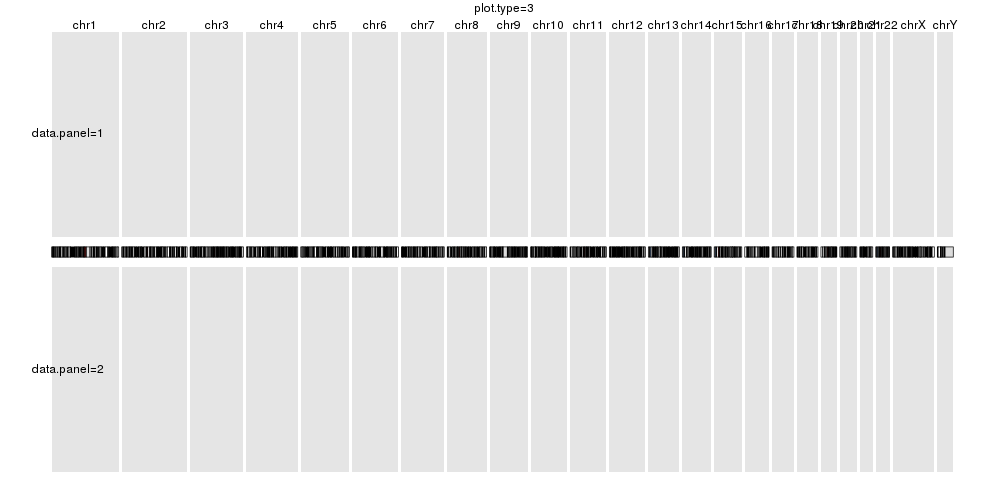
The simplest (and default) plot type is 1, wich represents the ideograms as horizontal bars vertically stacked with a single data panel above them. Plot type 2 adds a second data panel below the ideograms and plot types 3 to 5 represent the chromosomes as a single line of horizontal ideograms (think a manhattan plot) with variation in the number and position of the data panels. Finally, plot types 6 and 7 do not have standard data panels and can be used to create ideogram only plots.
These are the available data types:
plot.type=1
library(karyoploteR)

kp <- plotKaryotype(plot.type=1, main="plot.type=1")
kpDataBackground(kp, data.panel = 1)
kpText(kp, chr="chr1", x=60e6, y=0.5, labels="data.panel=1", data.panel = 1)
plot.type=2
kp <- plotKaryotype(plot.type=2, main="plot.type=2")
kpDataBackground(kp, data.panel = 1)
kpText(kp, chr="chr1", x=60e6, y=0.5, labels="data.panel=1", data.panel = 1)
kpDataBackground(kp, data.panel = 2)
kpText(kp, chr="chr1", x=60e6, y=0.5, labels="data.panel=2", data.panel = 2)
plot.type=3
kp <- plotKaryotype(plot.type=3, main="plot.type=3")
kpDataBackground(kp, data.panel = 1)
kpText(kp, chr="chr1", x=60e6, y=0.5, labels="data.panel=1", data.panel = 1)
kpDataBackground(kp, data.panel = 2)
kpText(kp, chr="chr1", x=60e6, y=0.5, labels="data.panel=2", data.panel = 2)
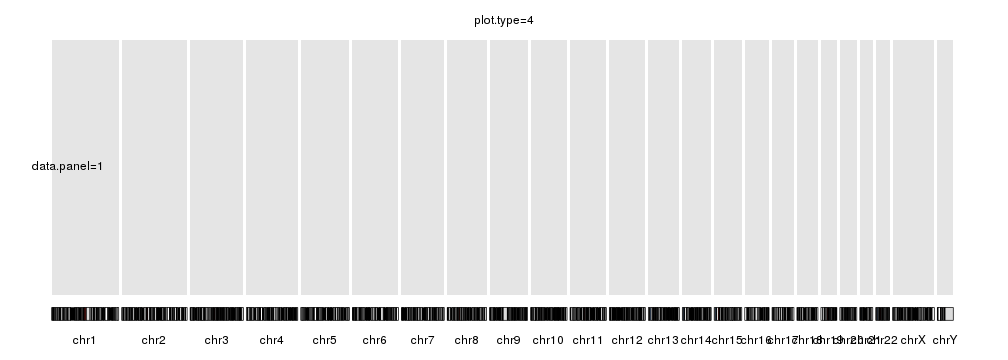
plot.type=4
kp <- plotKaryotype(plot.type=4, main="plot.type=4")
kpDataBackground(kp, data.panel = 1)
kpText(kp, chr="chr1", x=60e6, y=0.5, labels="data.panel=1", data.panel = 1)
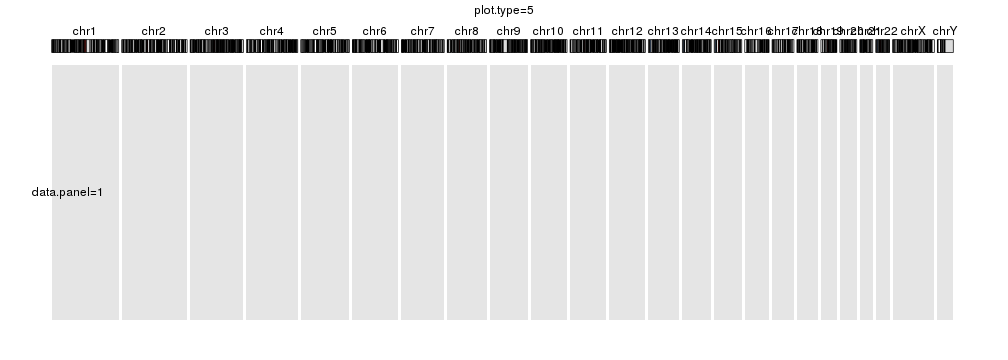
plot.type=5
kp <- plotKaryotype(plot.type=5, main="plot.type=5")
kpDataBackground(kp, data.panel = 1)
kpText(kp, chr="chr1", x=60e6, y=0.5, labels="data.panel=1", data.panel = 1)
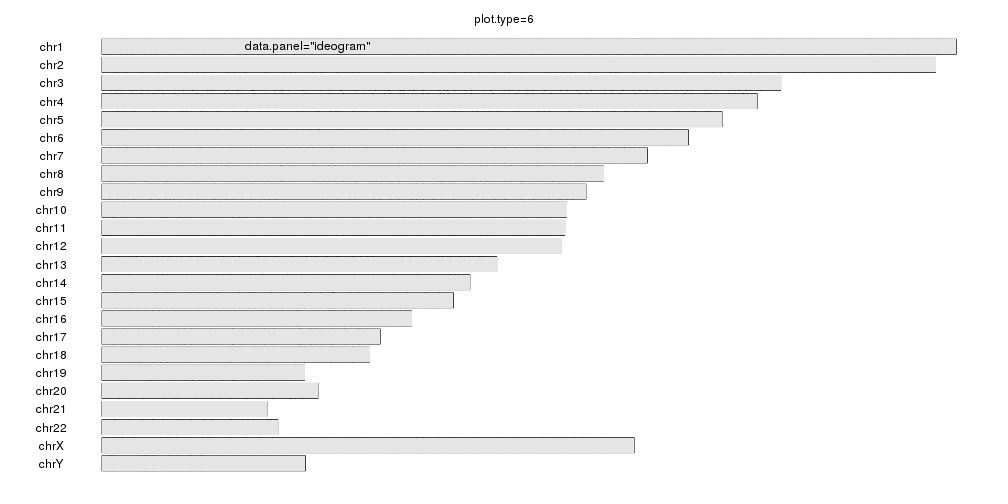
plot.type=6
kp <- plotKaryotype(plot.type=6, main="plot.type=6")
kpDataBackground(kp)
kpText(kp, chr="chr1", x=60e6, y=0.5, labels="data.panel=\"ideogram\"", data.panel = "ideogram")
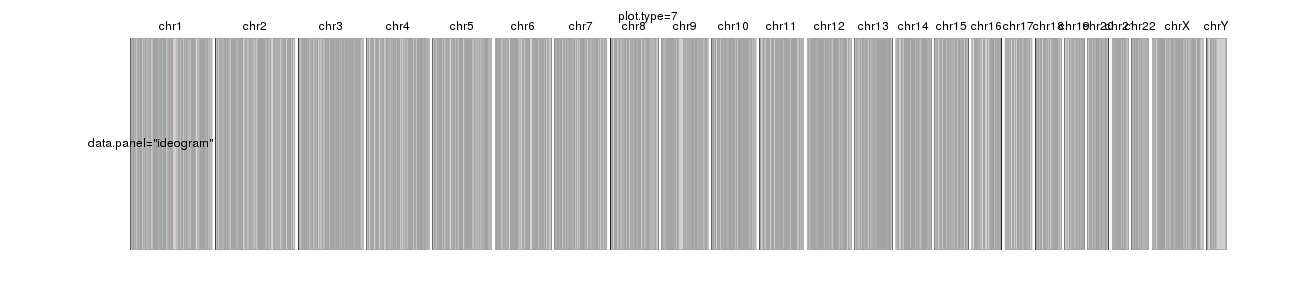
plot.type=7
Note: This plot type with full cytoband representation only makes sense for very wide plots or for a subset of chromosomes.
kp <- plotKaryotype(plot.type=7, main="plot.type=7")
kpDataBackground(kp, col="#CCCCCCCC")
kpText(kp, chr="chr1", x=60e6, y=0.5, labels="data.panel=\"ideogram\"", data.panel = "ideogram")