Plotting Polygon
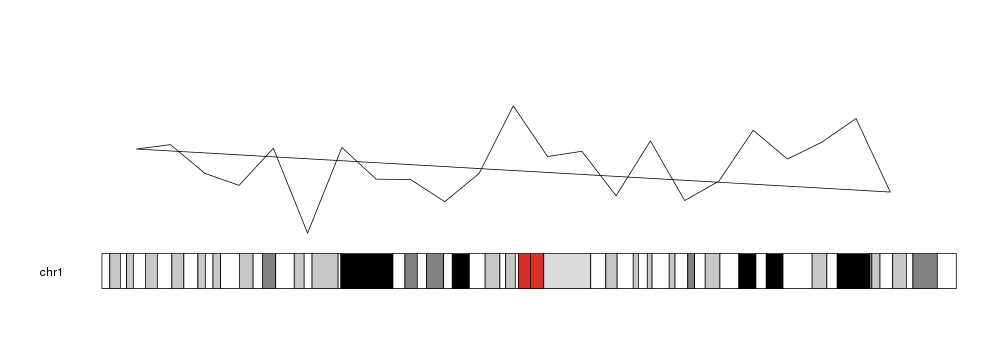
We can add polygons to a karyoplot with the kpPolygon function. Given a
character vector chr and two integer vectors x and y, it will draw a
closed polygon joining all specified points in the given order. And since it’s
a clodes polygon, it will draw a line between the first and last point.
library(karyoploteR)

x <- 1:23*10e6
y <- rnorm(23, mean=0.5, sd=0.25)

kp <- plotKaryotype(chromosomes="chr1")
kpPolygon(kp, chr="chr1", x=x, y=y)
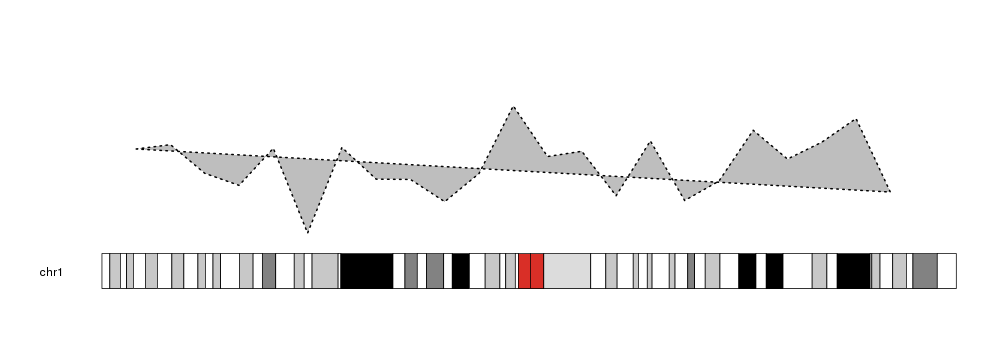
Polygons can be customized with the standard
graphical parameters
used in the polygon R base graphics function. As most closed shapes, they can
be filled. col is used to specifys the filling color and border the border color.
kp <- plotKaryotype(chromosomes="chr1")
kpPolygon(kp, chr="chr1", x=x, y=y, col="grey", border="black", lwd=2, lty=3)
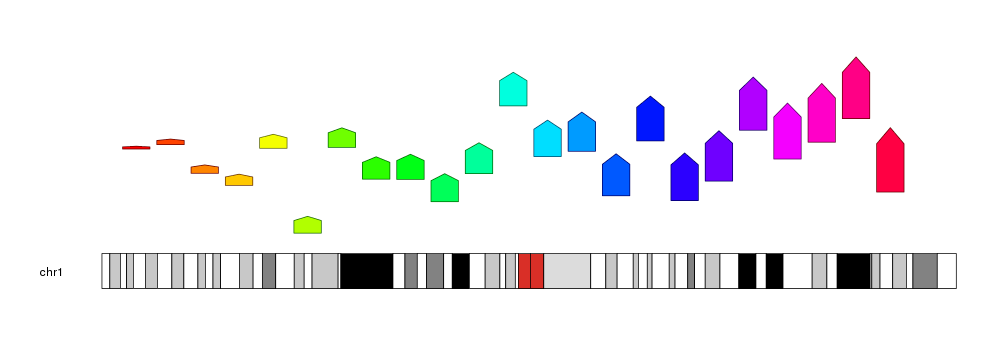
kpPolygon might not be obviouly useful, but it is used by different higher-level
plotting functions such as kpPlotRibbon with well crafted x and y vectors.
In addition, it adds some flexibility to create unusual plots.
kp <- plotKaryotype(chromosomes="chr1")
for(i in c(1:23)) {
  kpPolygon(kp, chr="chr1", x=x[i]+c(-4e6, -4e6, 0, 4e6, 4e6), y=y[i]+c(0, i*0.015, i*0.02, i*0.015, 0), col=rainbow(23)[i], border=darker(rainbow(23)[i]))
}