Labels
Adding labels to complex plots may help the viewer identifying the data plotted.
The function kpAddLabels is exactly for that. Labels will appear on the
left side of the plot, in the left margin, next to a
data panel. The data panel linked to each label is specified using the
data.panel parameter.
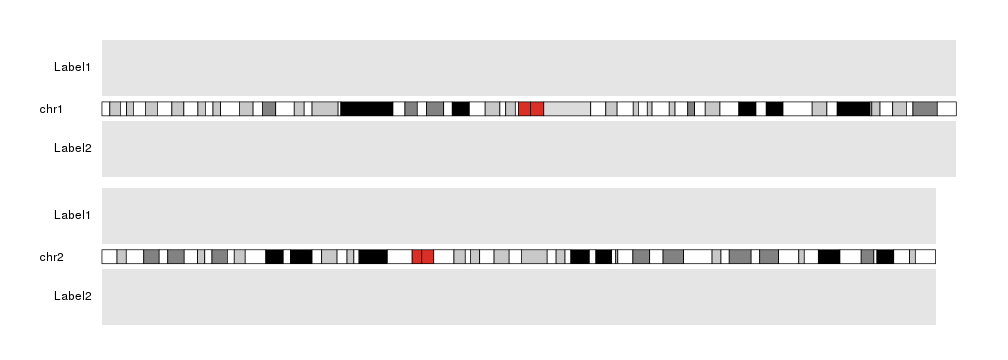
kp <- plotKaryotype(plot.type=2, chromosomes=c("chr1", "chr2"))
kpDataBackground(kp)
kpDataBackground(kp, data.panel = 2)
kpAddLabels(kp, labels="Label1", data.panel = 1)
kpAddLabels(kp, labels="Label2", data.panel = 2)
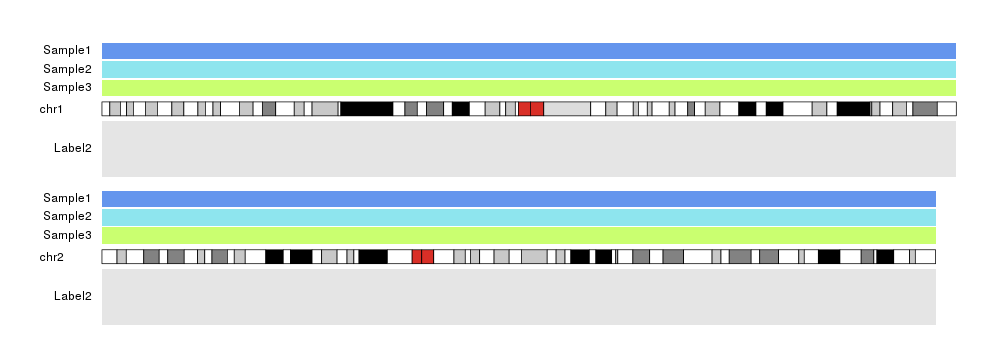
In addition to selecting a data panel we can also use r0 and r1 to define the vertical region for a label, so we can actually label different parts of a data panel, or different tracks.
For example, if we use data panel 1 to plot data on three different samples we could label them with
kp <- plotKaryotype(plot.type=2, chromosomes=c("chr1", "chr2"))
kpDataBackground(kp, r0=0.66, r1=0.96, color = "cornflowerblue")
kpAddLabels(kp, labels="Sample1", r0=0.66, r1=0.96, data.panel = 1)
kpDataBackground(kp, r0=0.33, r1=0.63, color = "cadetblue2")
kpAddLabels(kp, labels="Sample2", r0=0.33, r1=0.63, data.panel = 1)
kpDataBackground(kp, r0=0, r1=0.30, color = "darkolivegreen1")
kpAddLabels(kp, labels="Sample3", r0=0, r1=0.30, data.panel = 1)
kpDataBackground(kp, data.panel = 2)
kpAddLabels(kp, labels="Label2", data.panel = 2)
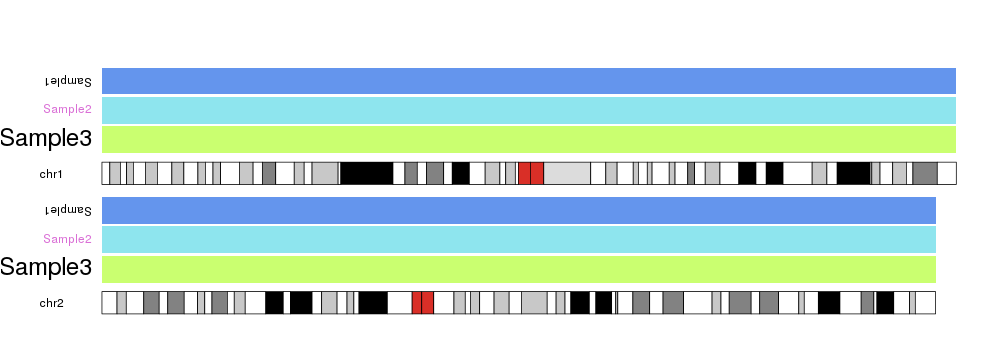
And we can apply any standard graphical parameter to the labels to tweak their appearance
kp <- plotKaryotype(plot.type=1, chromosomes=c("chr1", "chr2"))
kpDataBackground(kp, r0=0.66, r1=0.96, color = "cornflowerblue")
kpAddLabels(kp, labels="Sample1", r0=0.66, r1=0.96, data.panel = 1, srt=180, pos=4)
kpDataBackground(kp, r0=0.33, r1=0.63, color = "cadetblue2")
kpAddLabels(kp, labels="Sample2", r0=0.33, r1=0.63, data.panel = 1, col="orchid")
kpDataBackground(kp, r0=0, r1=0.30, color = "darkolivegreen1")
kpAddLabels(kp, labels="Sample3", r0=0, r1=0.30, data.panel = 1, cex=2)