Plot Genes
This example shows how to determine the position of some genes in the genome
and create a plot showing them. We’ll use Ensembl’s Biomart database to
automatically retrieve their position using the biomaRt
Bioconductor package. We’ll automatically convert the returned data frame into
a GRanges with regioneR’s toGRanges and since our genome is from UCSC, we’ll
need to change the chromosome name style from Ensembl to UCSC with
seqlevelsStyle. We’ll use genome GRCh38, the one used in the current biomart
version.
library(biomaRt)
library(regioneR)
gene.symbols <- c("AKT", "APC", "BCR", "BIRC3", "BRAF", "BRCA1", "BRCA2", "CDKN2C", "FEV", "TP53", "PTEN", "RB1")
ensembl <- useEnsembl(biomart="ensembl", dataset="hsapiens_gene_ensembl")
genes <- toGRanges(getBM(attributes=c('chromosome_name', 'start_position', 'end_position', 'hgnc_symbol'),
               filters = 'hgnc_symbol', values =gene.symbols, mart = ensembl))
seqlevelsStyle(genes) <- "UCSC"

head(genes)
## GRanges object with 6 ranges and 1 metadata column:
##       seqnames              ranges strand | hgnc_symbol
##          <Rle>           <IRanges>  <Rle> |    <factor>
##   [1]     chr5 112707498-112846239      * |         APC
##   [2]    chr22   23179704-23318037      * |         BCR
##   [3]    chr11 102317450-102339403      * |       BIRC3
##   [4]     chr7 140719327-140924928      * |        BRAF
##   [5]    chr17   43044295-43170245      * |       BRCA1
##   [6]    chr13   32315474-32400266      * |       BRCA2
##   -------
##   seqinfo: 10 sequences from an unspecified genome; no seqlengths
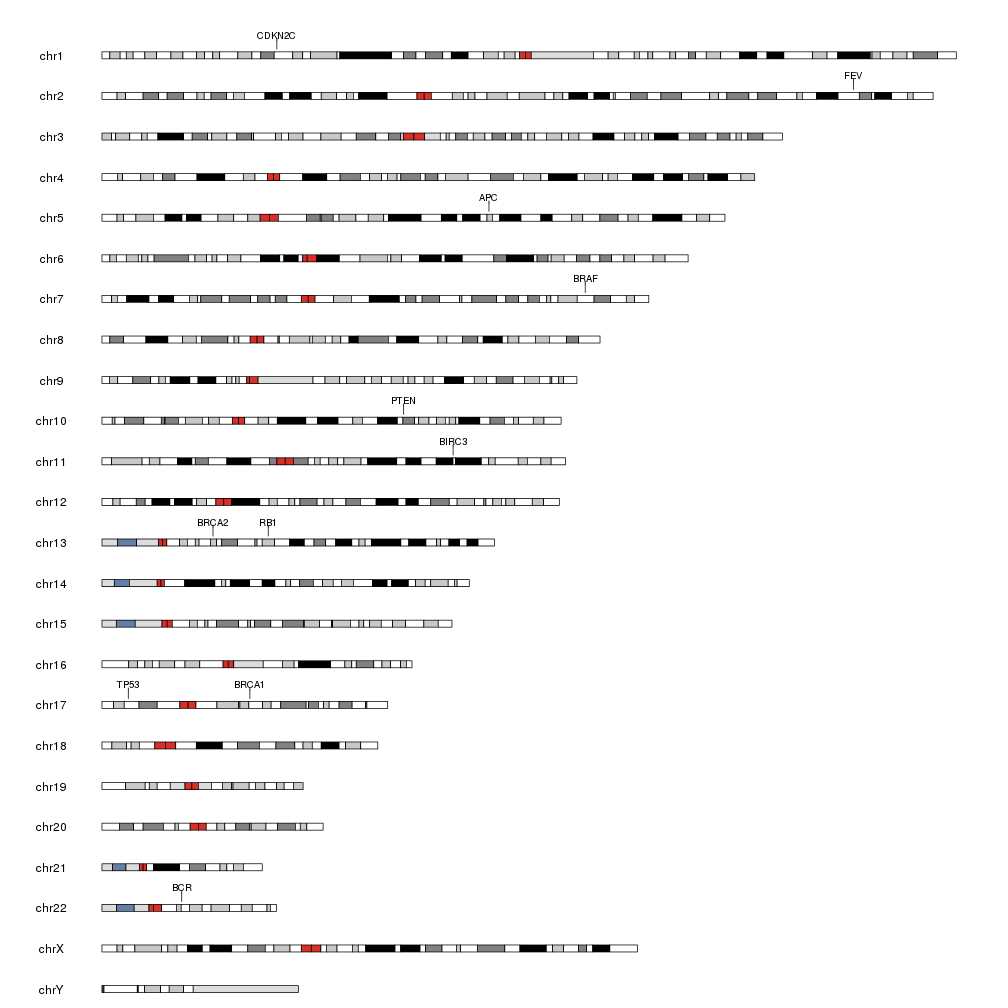
Once we have the data prepared we can use kpPlotMarkers to plot them on the
genome.
library(karyoploteR)
kp <- plotKaryotype(genome="hg38")
kpPlotMarkers(kp, data=genes, labels=genes$hgnc_symbol)
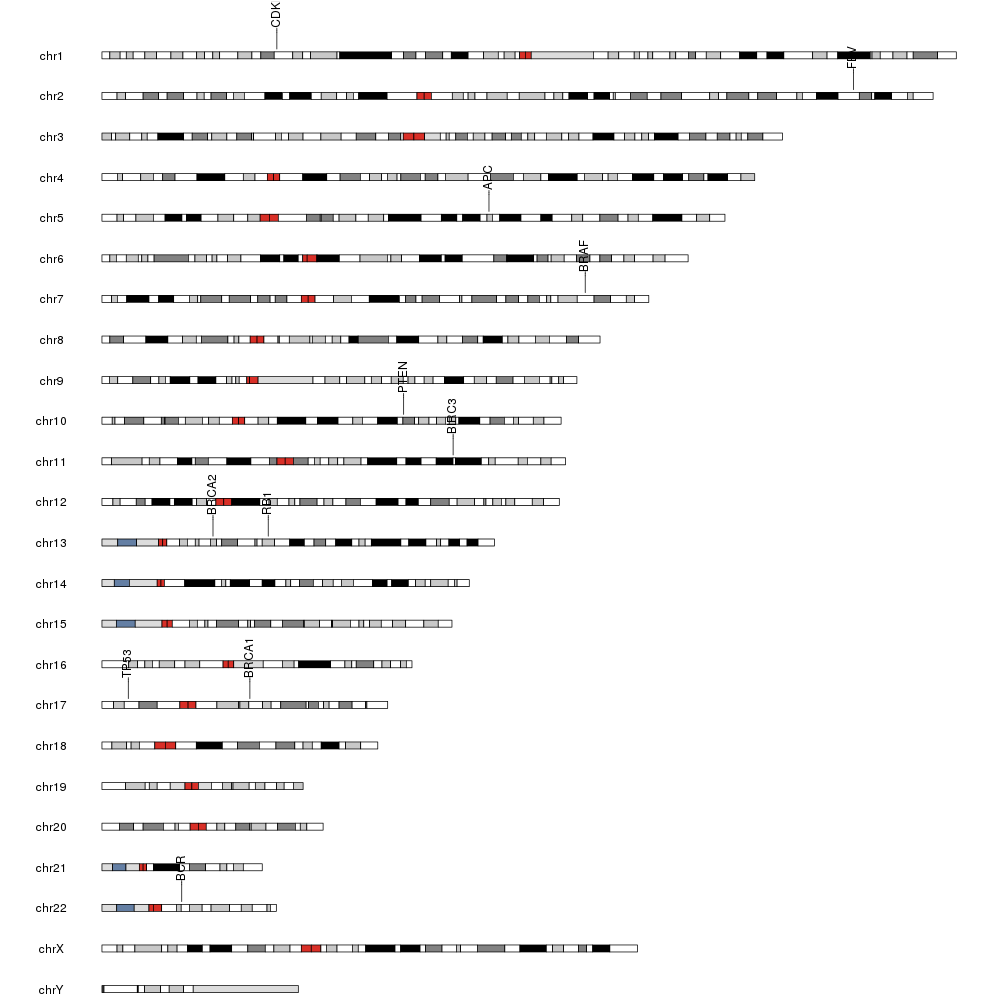
The gene labels are not readable since they overlap the ideograms. To solve this we will tweak the plot a bit: make the labels horizontal, reduce them and move them closer to their ideograms specifying lower r1 and adjusting the label.margin.
kp <- plotKaryotype(genome="hg38")
kpPlotMarkers(kp, data=genes, labels=genes$hgnc_symbol, text.orientation = "horizontal",
              r1=0.5, cex=0.8, adjust.label.position = FALSE)