Plotting Rectangles
To plot rectangles in a karyoplot we need to use the kpRect function. Given a
character vector chr and 4 integer vectors x0, y0, x1 and y1 it
will plot rectangles with an angle at (x0, y0) and the oposite one at
(x1, y1).
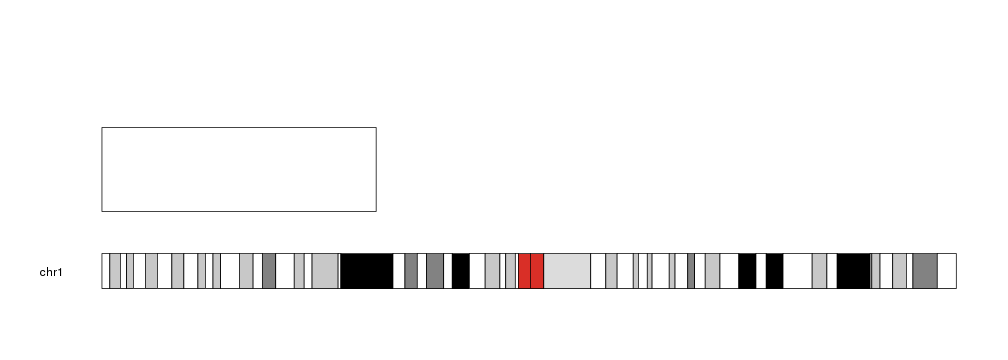
library(karyoploteR)

kp <- plotKaryotype(chromosomes="chr1")
kpRect(kp, chr="chr1", x0=0, x1=80e6, y0=0.2, y1=0.8)
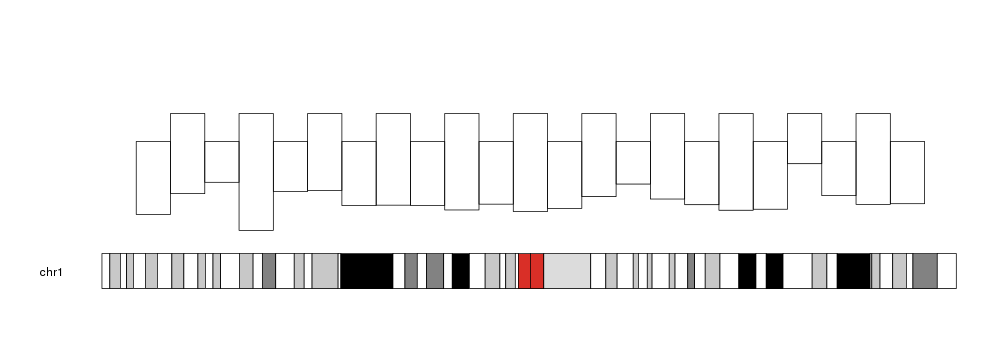
We can give it vectors of positions and it will plot a rectangle for each element in the vectors (recycling them if necessary).
x0 <- 1:23*10e6
x1 <- 2:24*10e6
y0 <- rnorm(23, mean=0.3, sd=0.1)
y1 <- c(0.7, 0.9)

kp <- plotKaryotype(chromosomes="chr1")
kpRect(kp, chr="chr1", x0=x0, x1=x1, y0=y0, y1=y1)
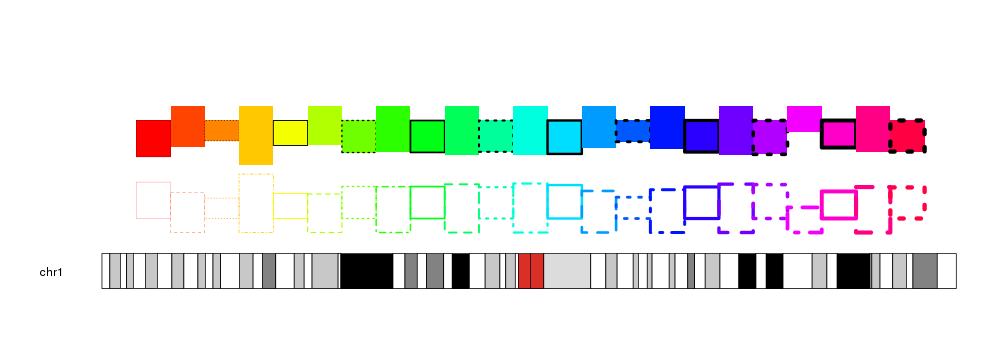
The rectangles can be customized with the same
graphical parameters
as in the R base graphics rect function: border, lty, col… Taking into
account that to produce rectangles without border we need border=NA (and not
border=NULL).
kp <- plotKaryotype(chromosomes="chr1")
kpRect(kp, chr="chr1", x0=x0, x1=x1, y0=y0, y1=y1, col=rainbow(23),
           lty=c(1,2,3,4), lwd=(1:23)/4, r0=0.5, r1=1, border=c("black", NA))
kpRect(kp, chr="chr1", x0=x0, x1=x1, y0=y0, y1=y1, border=rainbow(23),
           lty=c(1,2,3,4), lwd=(1:23)/4, r0=0.5, r1=0)