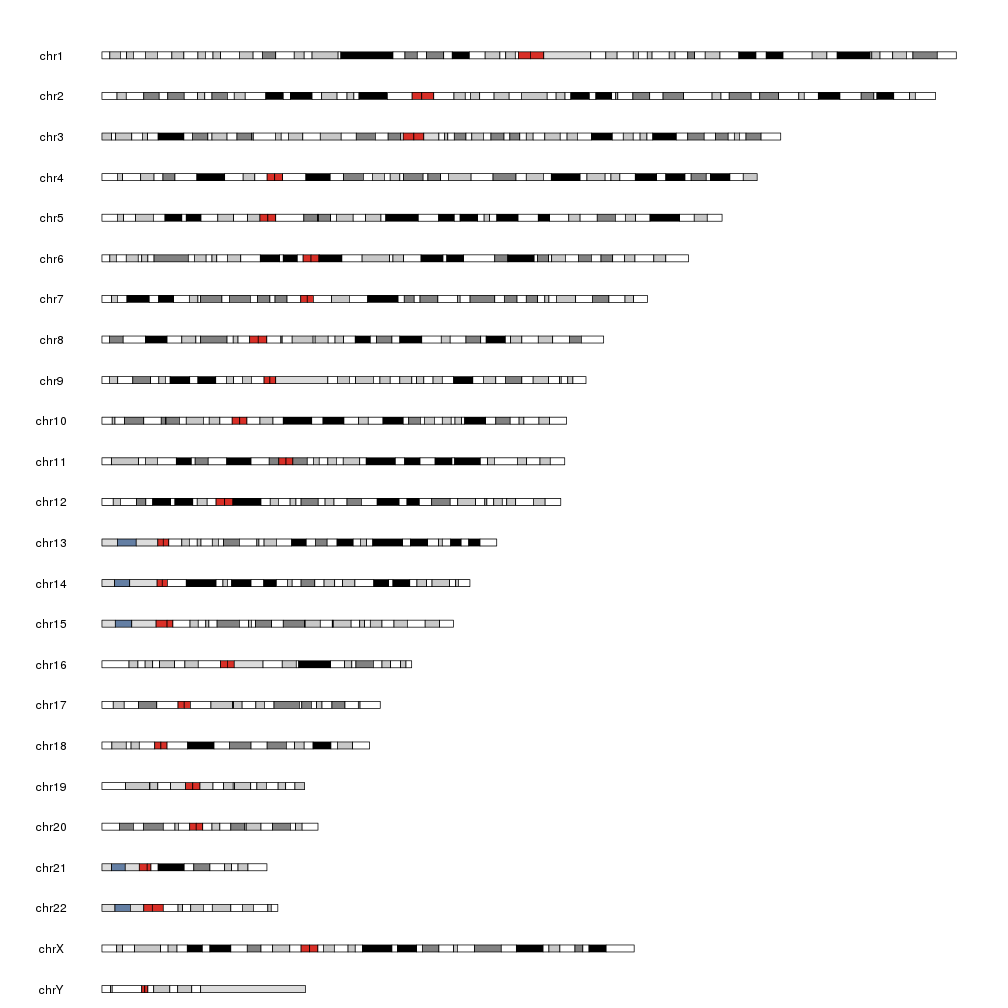
Plot an ideogram
The first step when creating a karyoplot is to create the empty ideogram plot where data will later be added.
The plotKaryotype function does just that and returns the
karyoplot object. We will need this object later on when
we need to add data to the plot.
By default it will create a karyoplot of the human genome hg19
library(karyoploteR)

kp <- plotKaryotype()
It is possible to specify other genomes. If it’s one of the few included in the
package it will be plotted from cache and if it’s not, karyoploteR will try to load the
corresponding BSGenome library and connect to UCSC to download the the cytobands. The
BSGenome needs to be installed in the system. Use installed.genomes() from package
BSGenome to list them.
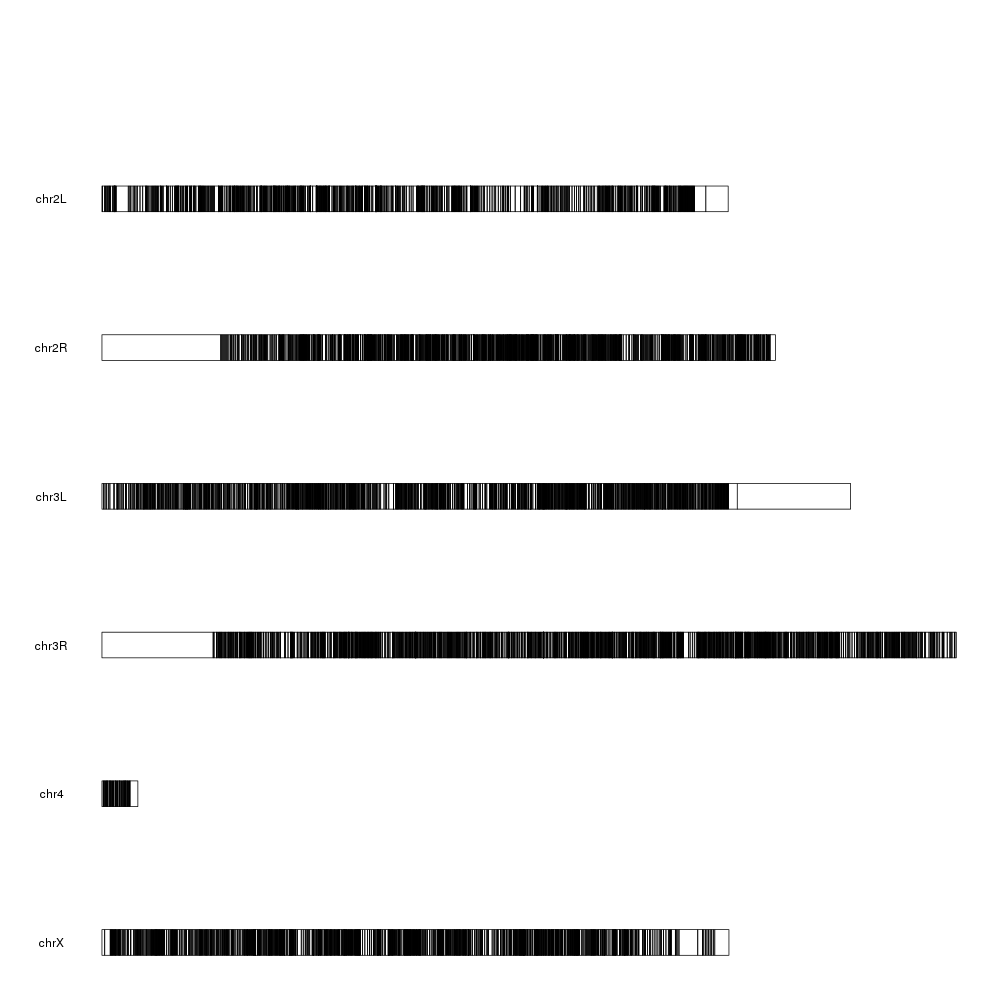
#Drosophila
kp <- plotKaryotype(genome = "dm6")