Add the base numbers to a genome
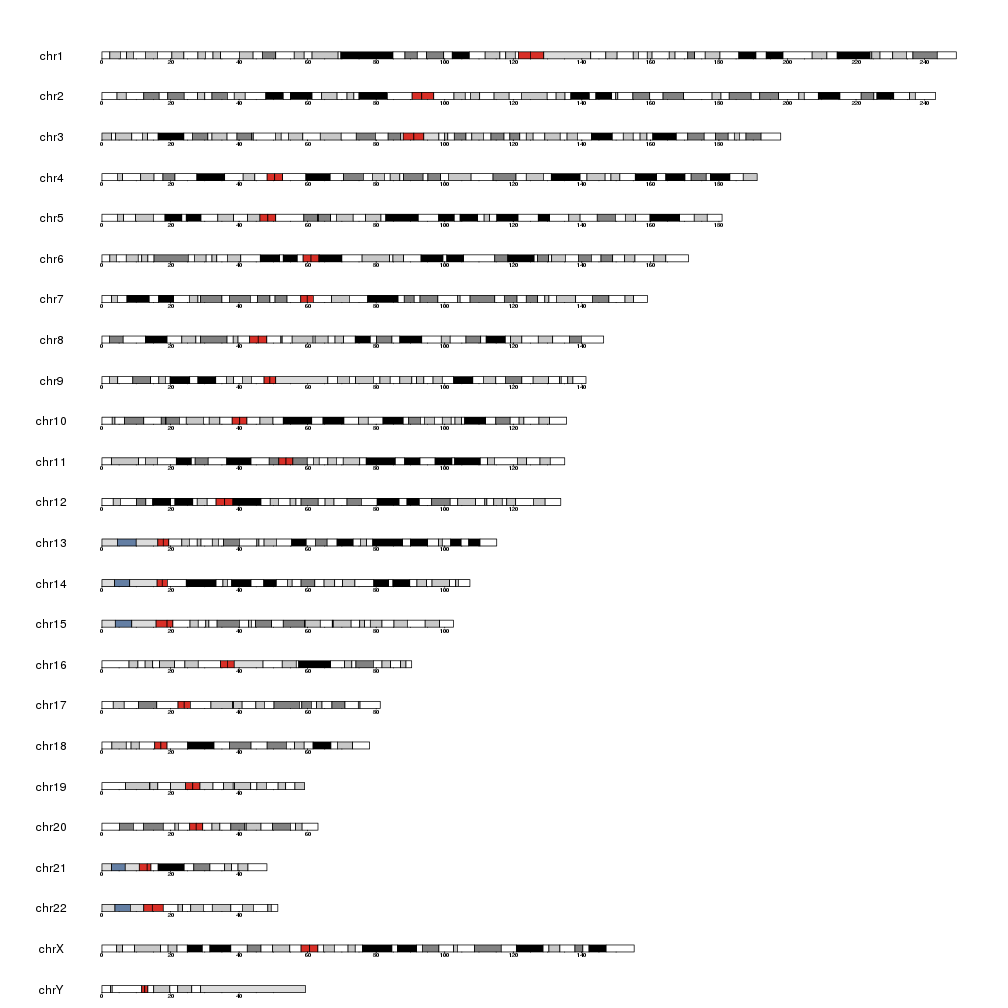
In some cases it might be interesting to add a guide of the base numbering to the ideograms. The default function in karyoploteR to do that is kpAddBaseNumbers. It will add the base numbering below each chromosome in the karyoplot.
library(karyoploteR)

kp <- plotKaryotype()
kpAddBaseNumbers(kp)
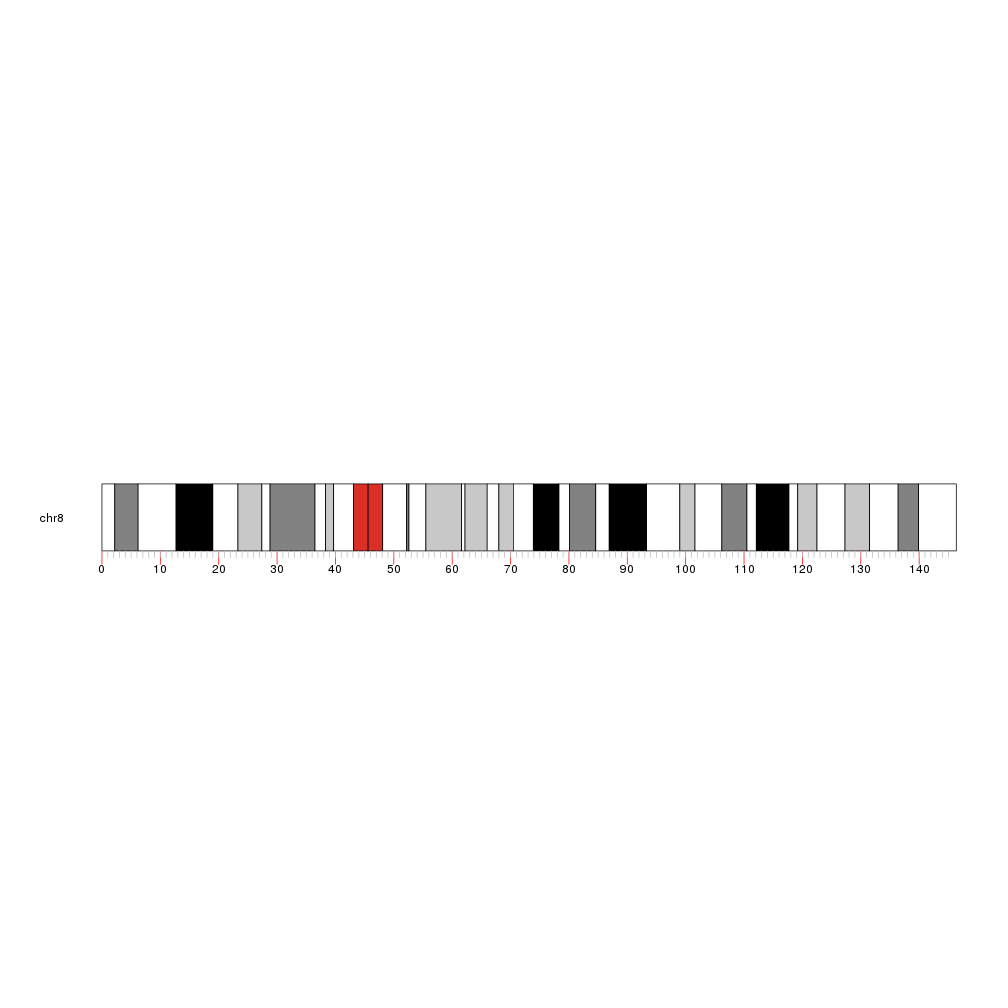
as with all other functions in karyoploteR it is possible to customize the appearance of the numbering mostly using standard graphics parameters. In addition, it is also possible to specify the distance between the tick marks and the size of the ticks. The color of the tick marks can be specified for all of them using col or separately for major and minor ticks using the specific parameters
kp <- plotKaryotype(chromosomes="chr8", plot.type = 2)

kpAddBaseNumbers(kp, tick.dist = 10000000, tick.len = 10, tick.col="red", cex=1,
                 minor.tick.dist = 1000000, minor.tick.len = 5, minor.tick.col = "gray")
Add the cytoband names to an ideogram
In addition to the base numbering it is possible to add the cytoband names to the ideogram. To do that we simply need a call to kpAddCytobandLabels.
kp <- plotKaryotype(chromosomes="chr17")
kpAddCytobandLabels(kp)

and we can adjust the label sizes with cex
kp <- plotKaryotype(chromosomes="chr17")
kpAddCytobandLabels(kp, cex=1.5)
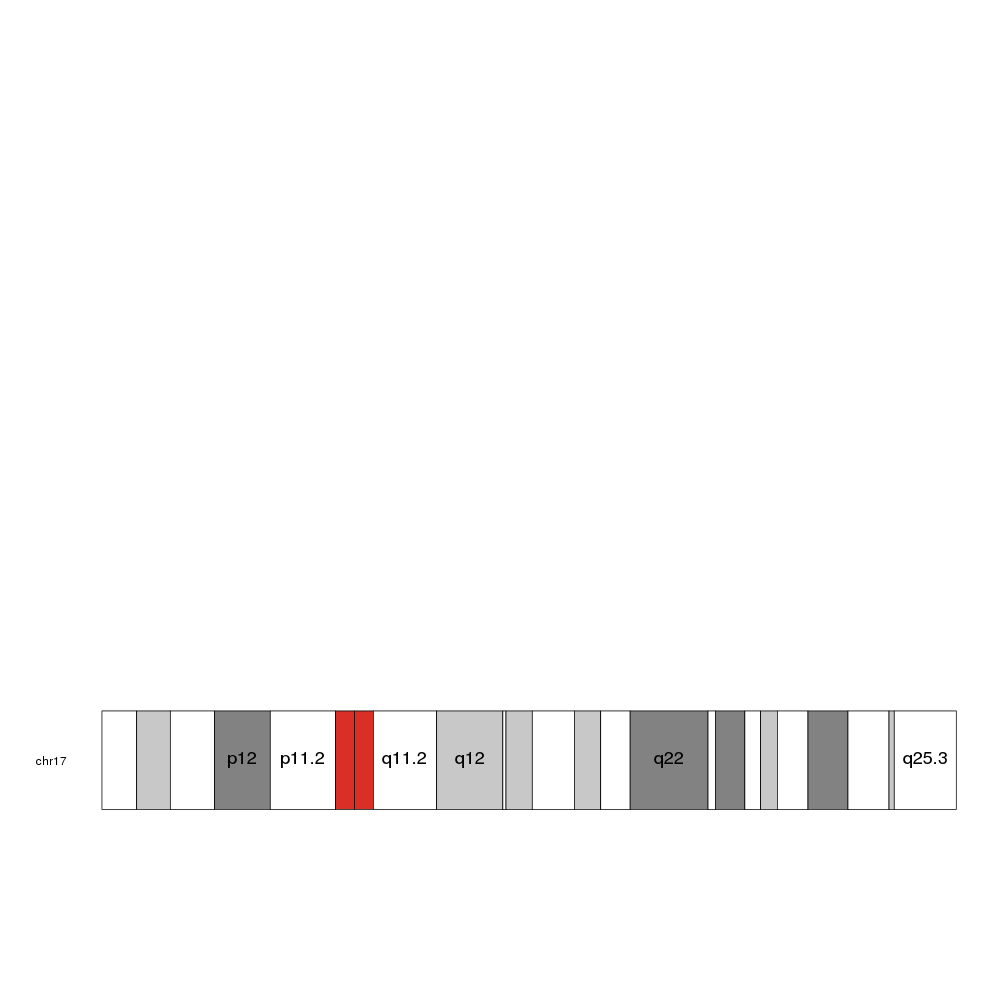
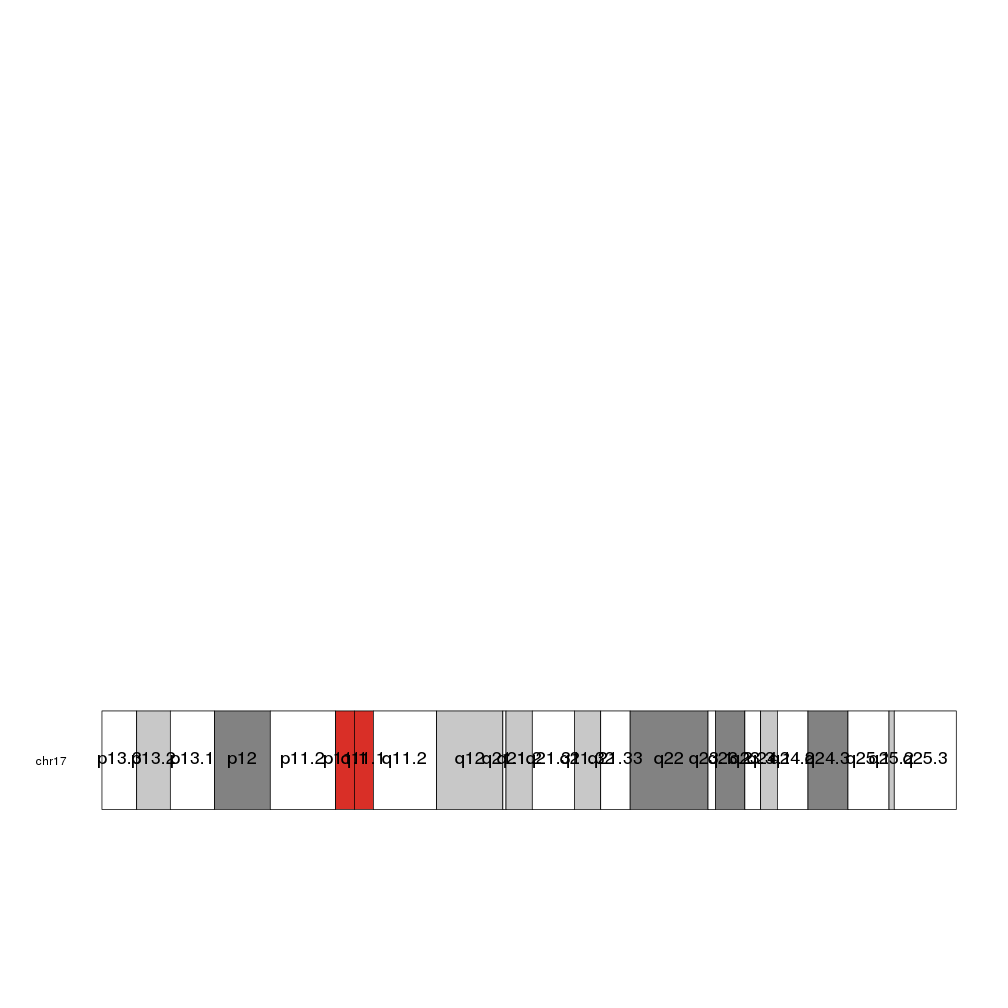
By default, it checks the size of the label and plots only those that fit inside their cytoband. To force it to plot all labels even if they end up spilling or overlapping, set force.all to TRUE
kp <- plotKaryotype(chromosomes="chr17")
kpAddCytobandLabels(kp, cex=1.5, force.all = TRUE)
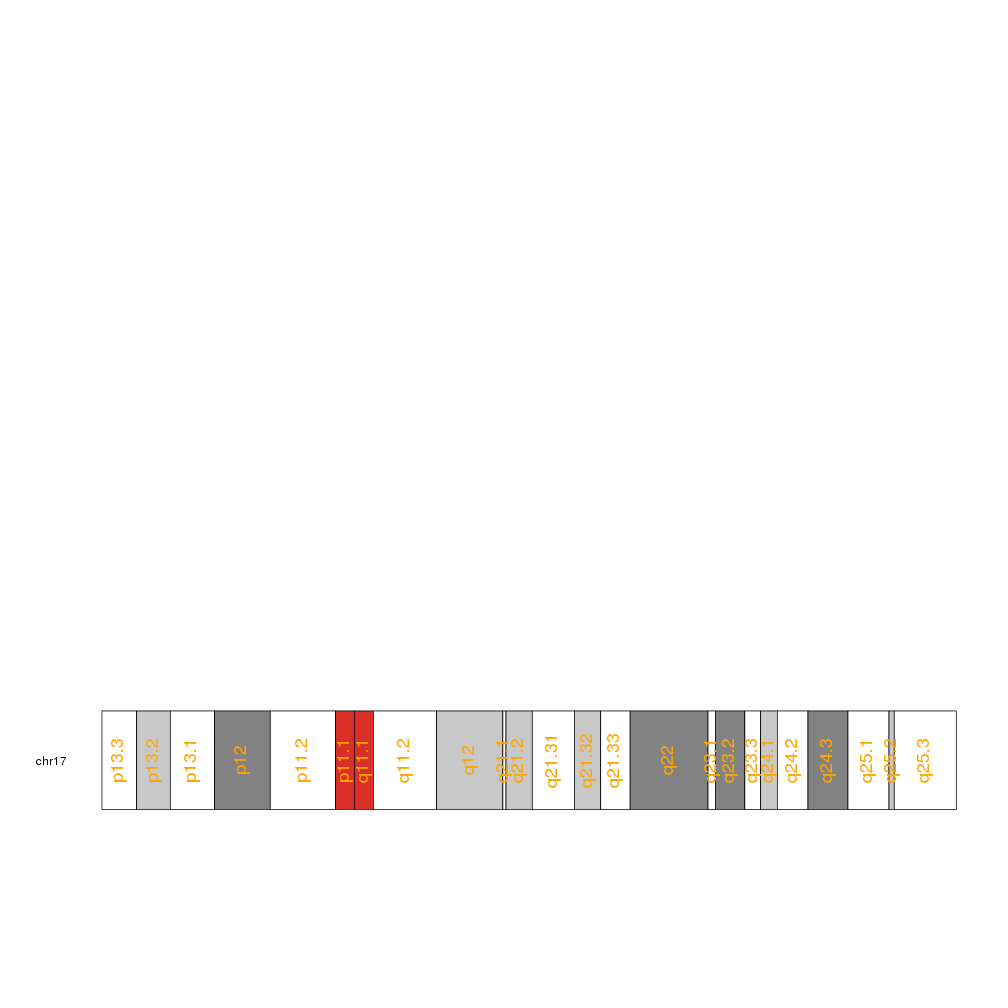
Again, it is possible to customize the plotting with the standard graphical parameters
kp <- plotKaryotype(chromosomes="chr17")
kpAddCytobandLabels(kp, force.all=TRUE, srt=90, col="orange", cex=1.5)